How to track feedback impact in product development in 2026
How to track feedback impact in product development in 2026
How to track feedback impact in product development in 2026
/
7 mins read

TL;DR
Collecting feedback is the easy part. The harder problem, and the one most product teams never fully solve, is proving that feedback actually influenced a product decision and shifted user behavior in a measurable way. This article gives product managers a four-step methodology for doing exactly that: mapping feedback signals to specific product changes, defining the behavioral metric each change was meant to move, measuring the delta in feature adoption and engagement after the change ships, and presenting that evidence to the roadmap process in a format that holds up to scrutiny. It also covers the three most common mistakes that break the feedback-to-impact loop, including why post-change CSAT scores and sentiment improvements are lag measures that produce reports rather than evidence. The article closes with the specific implication of Intelligence-Led Growth (ILG) for feedback tracking: in an ILG model, the PM's accountability shifts from shipping a response to feedback to proving that the product's response changed individual user behavior in real time.
Your team runs in-app surveys. You tag support tickets. You review NPS comments before every planning cycle. And then, at roadmap review, someone asks the question that no one has a clean answer to: did any of that actually move the needle?
The problem is not the volume of feedback. Product teams today have more user friction signals than they know what to do with. The problem is attribution, the absence of a documented link between what users said, what the team shipped in response, and whether user behavior changed as a result.
This article is about building that link. It assumes you already have a feedback program. What it gives you is the methodology to prove it worked.
Why feedback initiatives stall at the roadmap
Product teams rarely have a feedback shortage. They have a proof shortage.
The typical cycle looks like this: surveys go out, responses come in, themes get tagged, and the most-requested items get added to the backlog. At the next planning cycle, the team points to the feedback volume as justification for a prioritization decision. Leadership asks whether the last feedback-triggered change actually worked. Nobody has a clean answer.
The gap lives between two things that are almost never connected:
What users said: captured in survey tools, NPS comments, and support tickets
What happened in the product afterward: buried in analytics, session data, and feature usage reports
Most teams treat user friction signals as inputs to prioritization and stop there. They never close the loop back to behavior. The result is a feedback program that feels productive but produces no institutional evidence — which means it gets re-litigated at every planning cycle, and the PM has to make the case for feedback's value from scratch each time.
For guidance on how to measure what happens before this loop even starts, see measuring onboarding success. This article picks up where that one ends: after the feedback has been collected, and after a change has shipped.
What tracking feedback impact actually means
Tracking feedback impact is not the same as tracking feedback. The distinction matters because most tools that help teams collect and organise user feedback stop at the collection and categorisation layer. Impact tracking starts after that.
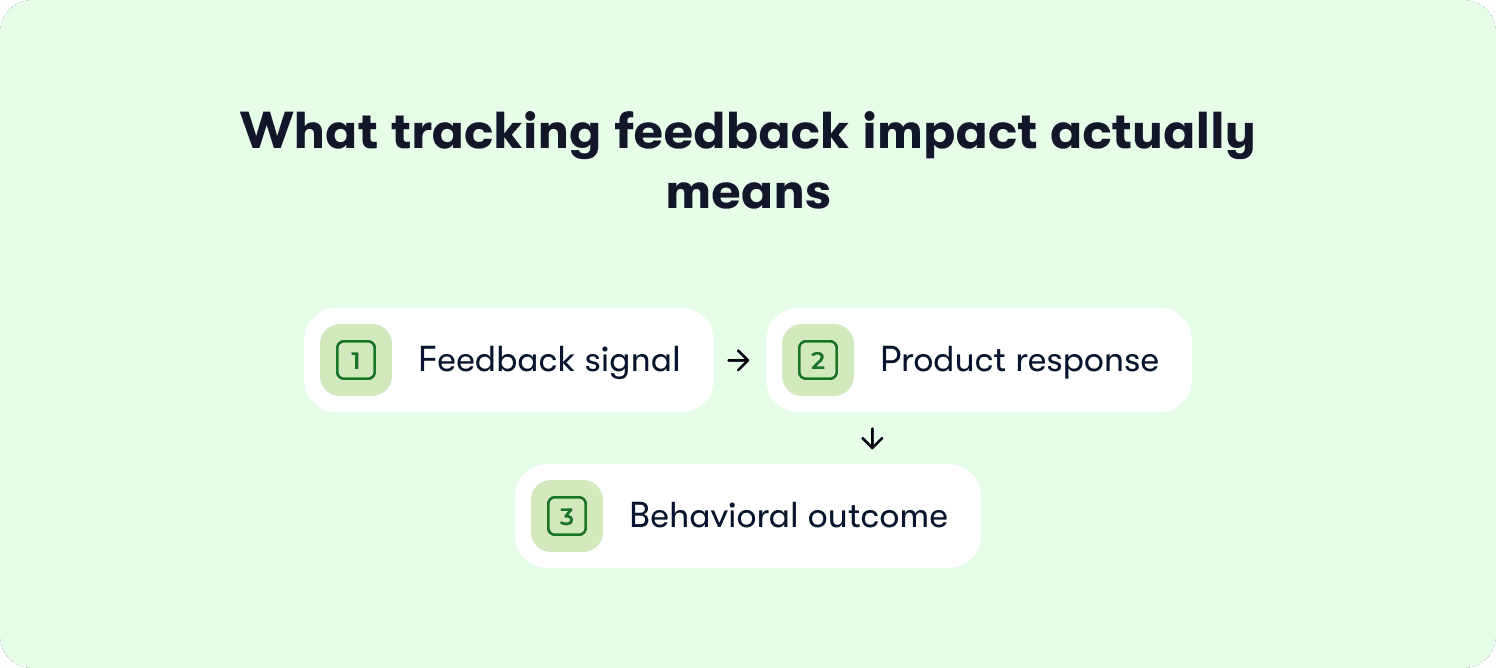
There are three things a product manager needs to hold separately to make this work:
Feedback signal
What users said, a pattern of NPS comments, an in-app survey response cluster, a recurring support ticket theme, etc. The signal is the input that justifies a product decision.
Product response
What the team shipped as a direct result of that signal: a redesigned flow, a new contextual tooltip, a change to the default state of a feature. The response is the intervention.
Behavioral outcome
Whether a specific, pre-named metric moved after the intervention shipped (feature discovery rate, task completion, session depth on the affected flow). The outcome is the evidence.
Most teams track the signal well. Some document the product response. Almost none defines the behavioral outcome in advance and measures it afterward. That third step is what separates a feedback program that informs the roadmap from one that can prove it shaped it.
A four-step methodology for tracking feedback impact
The following steps give product managers a repeatable process for connecting a feedback signal to a measurable behavioral outcome. Each step builds on the previous one. Skipping any of them breaks the attribution chain.
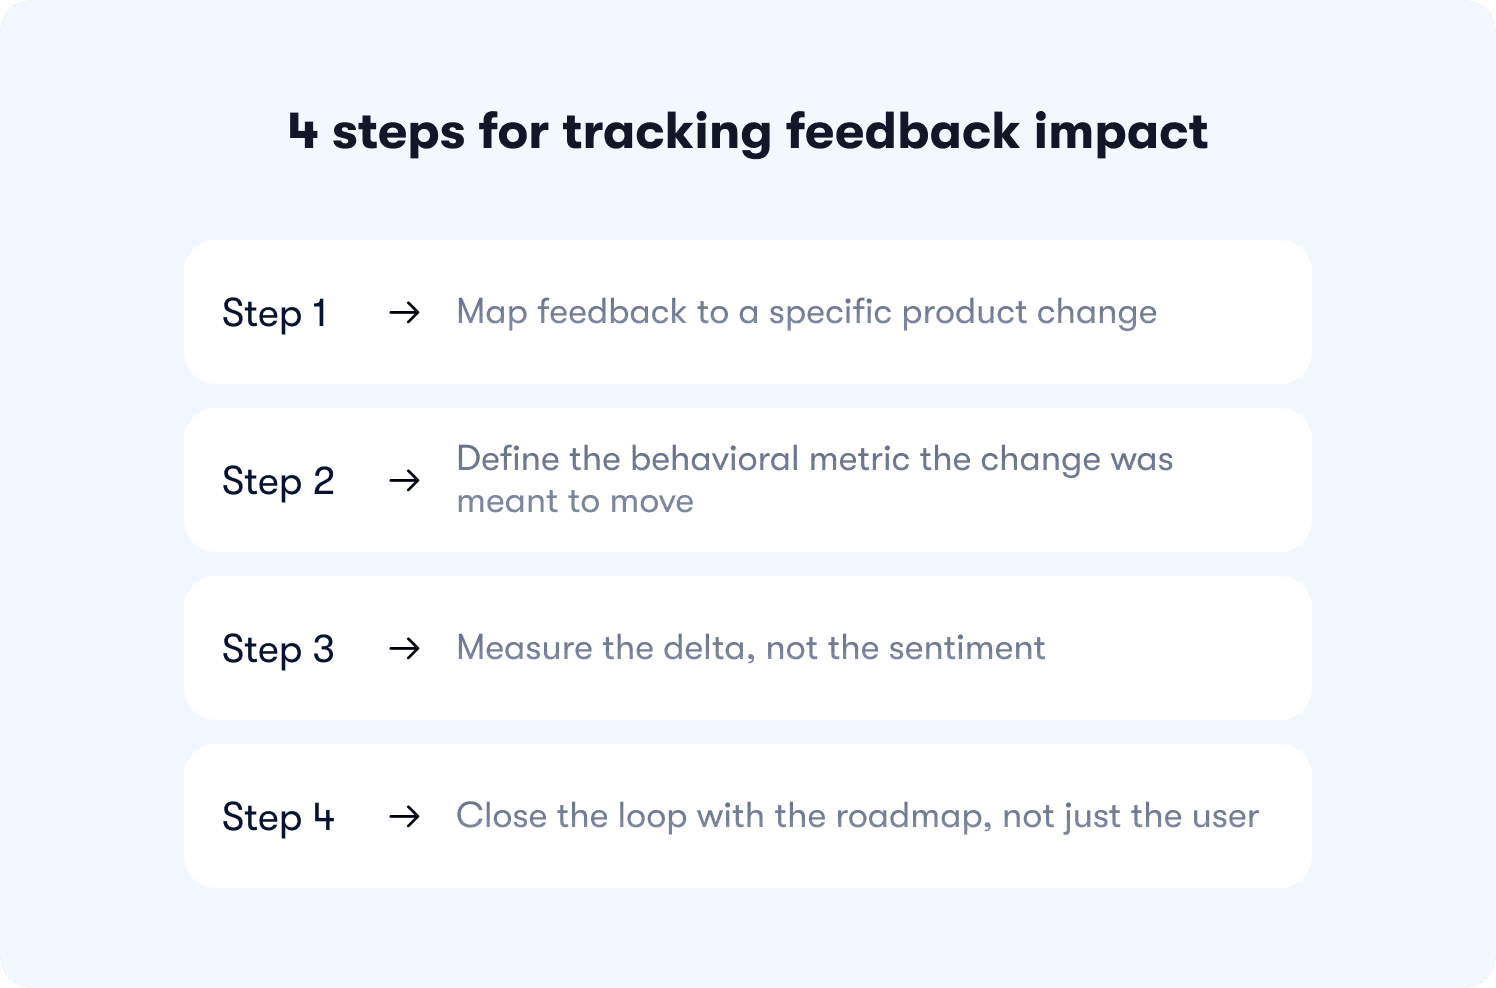
Step 1: Map feedback to a specific product change
The most common reason feedback fails to influence roadmaps is not that decision-makers ignore it. It is that no one created a traceable record connecting a specific piece of feedback to a specific product decision. When that record does not exist, the attribution argument falls apart before it starts.
Building that record requires three habits:
Tag feedback by theme at the point of collection
When a pattern emerges across survey responses or support tickets, it needs a label that travels with it through the planning process. A tag like "reporting feature confusion" is traceable. "UX issues" is not. The more specific the tag, the easier it is to point to it six weeks later when the fix ships and the measurement window opens.
Attach the feedback theme to the ticket or spec
When a product change is scoped, the feedback signal that motivated it should be referenced directly in the ticket or product spec. This is the timestamped link that makes attribution possible. Without it, there is no way to isolate whether a metric moved because of this change or because of something else that shipped the same week.
Record the intervention date
The date a feedback-triggered change goes live is the start of the measurement window in Step 3. Teams that do not record it cannot set a clean before-and-after baseline. A note in the ticket, a tag in the changelog, or a row in a shared tracker all work: the format matters less than the discipline of doing it consistently.
None of this requires a sophisticated system. It requires a shared agreement that feedback-triggered changes are documented differently from feature work that originated internally, and that the link between signal and decision is never left implicit.
Step 2: Define the behavioral metric the change was meant to move
Before a feedback-triggered change ships, the team needs to name one thing: which metric should move if the change works? This sounds obvious. In practice, most teams skip it, and without a pre-defined metric, there is nothing to measure against when the change goes live.
This is the feedback hypothesis, and it has a simple structure:
"Users reported [X]. We shipped [Y]. We expect [Z metric] to move by [timeframe]."
Choosing the right behavioral metric
Not every metric is the right signal for every change. The goal is to match the metric to the specific behavior the change was designed to affect. Some useful starting points:
Activation rate: for changes designed to help users reach their first value moment faster
Feature adoption rate: for changes targeting a specific capability that users were not discovering or using
Task completion rate: for changes to a specific flow where drop-off was identified in the feedback signal
Funnel analysis conversion at a specific step: for changes addressing a reported friction point at a known drop-off stage
Avoid choosing metrics that are too broad to be sensitive to a single product change. If the metric takes six months to move visibly, it will not give the PM the lead time needed to course correct or build the roadmap case.
Setting the measurement window
The measurement window should be defined before the change ships, not after. A 30-day window is a reasonable default for most feature-level changes. Changes to core flows or onboarding sequences may warrant a longer window to capture return-visit behavior. The key is that the window is fixed in advance and expanding it after the fact because the metric did not move is not a measurement discipline, it is rationalization.
Step 3: Measure the delta, not the sentiment
After a feedback-triggered change ships, the instinct for most teams is to check whether the next round of feedback scores higher. That instinct produces a report, not evidence. Sentiment scores are lag measures. By the time they move, the experience that caused the movement is already weeks old.
What the PM needs instead is a behavioral delta: did the specific metric named in Step 2 move, and by how much, relative to the baseline set before the change shipped?
The signals worth measuring
Product analytics data is where the delta lives. The most reliable post-change signals for feature-level interventions are:
Feature adoption rate: the percentage of active users engaging with the specific capability the change was designed to surface
Task completion rate: whether users are completing the flow the change was meant to fix, at a higher rate than before
Session depth on the affected flow: whether users are spending more time in the relevant part of the product, indicating reduced confusion rather than abandonment
Avoid using post-change CSAT or NPS movement as primary evidence. Both measure sentiment at a point in time. Neither tells you whether a specific user behavior changed because of a specific product decision. For a full treatment of how to run your NPS program well, see the Jimo NPS article. This step is about what comes after sentiment.
Closing the loop with data
This is where the methodology moves from spreadsheet to system. Jimo connects behavior-triggered messaging and in-product survey responses directly to downstream feature engagement data, so the correlation between what a user reported and how their behavior changed afterward is visible in one place. Customer Alliance used this approach and recorded a 970% spike in feature adoption following a feedback-triggered product change. See the full picture in Jimo customer stories.
Use behavior metrics and retention insights to track the delta across the measurement window defined in Step 2.
Step 4: Close the loop with the roadmap, not just the user
Most feedback management advice ends at telling the user what shipped. That is necessary, but it is not sufficient. The PM also needs to present the behavioral delta to the roadmap process as documented evidence, or the next planning cycle starts from zero again.
What a feedback impact report contains
The report does not need to be long. It needs to be traceable. Four components are enough:
The feedback signal: what users reported, how many responses carried the theme, and when the pattern was identified
The product response: what shipped, when it went live, and which ticket or spec it is documented in
The behavioral outcome: which metric was pre-named in Step 2, what the baseline was, and what the delta was at the close of the measurement window
The next iteration: what the data suggests the team should do next, whether that is expanding the change, adjusting it, or moving on
This structure turns a feedback program from a voice-of-customer exercise into an evidence trail. Use actionable reports and the Jimo Success Tracker to build and store these reports in a format the roadmap process can reference directly.
Why this step is the one most teams skip
Closing the loop with the user feels like the finish line. An in-product announcement goes out, the ticket closes, and the cycle feels complete. The institutional evidence, the documented link between signal, intervention, and behavioral outcome, never gets written up. At the next planning cycle, the PM is back to making the case for feedback's value without any proof that it worked last time. The report in Step 4 is what breaks that cycle.
What a feedback impact report looks like in practice
Consider a product manager at a B2B SaaS company, 120 employees, running a product-led growth motion. Over three weeks, a cluster of in-app survey responses identifies the same problem: users are not finding the reporting dashboard until late in their trial, often after they have already formed a negative impression of the product's depth.
The PM documents the feedback theme, attaches it to a spec, and ships a contextual tooltip sequence using Jimo that surfaces the reporting dashboard at a specific trigger point in the user journey. The pre-named metric is feature discovery rate for the reporting dashboard. The measurement window is 30 days.
At the close of the window, feature discovery rate on the reporting dashboard has increased by 34%. Task completion within the dashboard is up 21%. The PM brings both numbers to the next roadmap review alongside the original feedback theme, the intervention date, and the baseline. The conversation shifts from "users want better reporting" to "we know what we shipped, we know what moved, and here is what we should do next."
The ILG shift: from feedback as input to feedback as signal
Product-led growth (PLG) treats feedback as an input to the roadmap process. A pattern emerges, a decision gets made, a change ships, and the cycle repeats on a quarterly cadence. The loop is real, but it is slow. By the time feedback influences a product decision and that decision reaches the user, the moment of friction that generated the signal is weeks or months in the past.
Intelligence-Led Growth (ILG) operates on a different premise. Feedback is not an input to the next planning cycle. It is a real-time signal the product responds to at the individual user level, immediately. When a user surfaces friction at a specific moment in the product, the product responds to that signal before the session ends, not before the next sprint.
For the PM, this changes the accountability question. In a PLG model, the question is: did we ship a response to this feedback? In an ILG model, the question is: did the product's response to that signal change this user's behavior, and can we prove it?
Jimo connects the feedback signal to the in-product response and measures the behavioral outcome in one system, without engineering dependency. The full loop, from what a user reported to how their behavior changed afterward, is visible and documented. That is what makes feedback impact tracking a growth discipline rather than a reporting exercise. For more on driving adoption outcomes once the signal has been acted on, see increase product adoption.
Why most feedback loops break before they close
Even teams that follow the methodology in good faith tend to lose the thread at one of three points. Understanding where the loop breaks is what makes the case for closing it systematically rather than manually.
Break point 1: Measuring sentiment instead of behavior
When post-change CSAT scores improve, it feels like evidence. It is not.
Sentiment tells you how users feel at a point in time. It does not tell you whether a specific behavior changed because of a specific product decision. Teams that rely on sentiment movement as their primary success metric will always struggle at roadmap review, because what they are presenting is a lag measure of perception, not a record of what changed in the product.
The metric that matters is behavioral. Did feature adoption rate move? Did task completion improve on the affected flow? Those are the numbers that hold up.
Break point 2: No timestamped intervention record
Without a documented link between the feedback signal and the product change, the delta measured in Step 3 is not defensible.
Feature adoption rate may have increased during the measurement window. But if the intervention date was never recorded, other variables cannot be ruled out:
A marketing campaign that ran the same week
A pricing change that affected user behavior
A separate product update that shipped in the same release
The attribution argument collapses not because the change did not work, but because the record that would prove it was never created.
Break point 3: Closing the loop with the user but not the roadmap
This is the break point that does the most damage over time.
Teams send an in-app announcement, the ticket closes, and the cycle feels complete. But the behavioral evidence from Step 4 never gets written up. The result:
The PM enters the next planning cycle without proof the feedback program produced a measurable outcome
The case for feedback's value has to be made from scratch, again
The program stays permanently in the position of justifying its own existence
Where the methodology alone is not enough
A manual process, applied consistently, can reduce these break points. It rarely eliminates them. The discipline required across tagging, timestamping, metric pre-naming, and impact reporting is significant. Any one step done inconsistently breaks the chain.
This is where Intelligence-Led Growth changes the accountability model. The question shifts from whether the team followed the right process to whether the product itself responded to the feedback signal, changed the individual user's experience, and produced a measurable behavioral outcome without anyone having to manually assemble the evidence trail.
Jimo connects in-product survey responses directly to downstream behavioral data, so the correlation between what a user reported and how their engagement changed afterward is documented automatically. The loop closes inside the product, not in a planning deck three weeks later.
If you want to see how that works in practice, book a demo.
FAQs
What is the difference between qualitative and quantitative feedback in product development?
Quantitative data tells you what is happening at scale: how many users dropped off a flow, what percentage completed a task, how feature adoption rates changed over time. Qualitative feedback tells you why. User interviews, open-ended survey responses, and customer support interactions surface the reasoning behind the numbers. The most defensible product decisions use both: quantitative data to identify where the problem lives, and qualitative feedback to understand what is driving it.
How should product teams prioritize feature requests from multiple channels?
Start by categorizing feedback based on two dimensions: frequency and business impact. A pain point raised by 40% of users in customer surveys carries more weight than an isolated request, but a single piece of feedback from a high-value account segment may outrank both if it aligns with retention risk. The goal is not to action every piece of customer input but to identify recurring themes that map directly to measurable outcomes on the product roadmap.
What is the most effective way to gather customer feedback without overwhelming users?
Timing and context matter more than volume. A single in-app survey triggered at a specific moment in the customer journey will consistently outperform a long feedback form sent to your entire user base on a fixed schedule. Keep surveys to one or two focused questions, trigger them after a meaningful interaction, and rotate collection across multiple channels so no single user segment carries a disproportionate response burden.
How do you translate raw feedback into actionable insights for the development process?
Raw feedback becomes actionable when it is tagged, grouped, and connected to a specific behavior or outcome. The process has three steps: tag responses by theme at the point of collection, group themes by frequency and affected user segment, and map each group to a metric that would move if the underlying problem were fixed. Customer opinions that cannot be connected to a measurable user need stay in the backlog. Those that map to a clear behavioral gap move to the roadmap.
What is the role of customer sentiment in feedback analysis?
Customer sentiment is a useful directional signal and a poor success metric. It tells you whether user perceptions are improving or deteriorating across the customer experience, which is valuable for spotting emerging trends before they show up in churn data. Where teams go wrong is treating sentiment scores as evidence that a specific product change worked. Sentiment is a lag measure: by the time it moves, the experience that caused the movement is already weeks old. Use it for trend monitoring, not impact attribution.
How do sales and marketing teams benefit from product feedback data?
Customer insights generated through the product feedback process are some of the most credible inputs available to sales and marketing teams. Recurring pain points surfaced in user feedback reveal the language customers use to describe their own problems, which is more reliable than internal assumptions when crafting messaging. Feature adoption data and customer satisfaction scores also help sales teams identify product-qualified leads and prioritize outreach toward accounts showing expansion signals.
How does continuous improvement through feedback support long-term product market fit?
Product market fit is not a milestone, it is a moving target. Customer needs evolve, market demand shifts, and the gap between what users expected when they signed up and what they need six months later is often where churn originates. A consistent feedback process that connects customer behavior to product decisions and measures the outcome of each intervention gives teams the data-driven decision making discipline needed to stay aligned with customer expectations over time, rather than discovering the drift after it shows up in retention metrics.
TL;DR
Collecting feedback is the easy part. The harder problem, and the one most product teams never fully solve, is proving that feedback actually influenced a product decision and shifted user behavior in a measurable way. This article gives product managers a four-step methodology for doing exactly that: mapping feedback signals to specific product changes, defining the behavioral metric each change was meant to move, measuring the delta in feature adoption and engagement after the change ships, and presenting that evidence to the roadmap process in a format that holds up to scrutiny. It also covers the three most common mistakes that break the feedback-to-impact loop, including why post-change CSAT scores and sentiment improvements are lag measures that produce reports rather than evidence. The article closes with the specific implication of Intelligence-Led Growth (ILG) for feedback tracking: in an ILG model, the PM's accountability shifts from shipping a response to feedback to proving that the product's response changed individual user behavior in real time.
Your team runs in-app surveys. You tag support tickets. You review NPS comments before every planning cycle. And then, at roadmap review, someone asks the question that no one has a clean answer to: did any of that actually move the needle?
The problem is not the volume of feedback. Product teams today have more user friction signals than they know what to do with. The problem is attribution, the absence of a documented link between what users said, what the team shipped in response, and whether user behavior changed as a result.
This article is about building that link. It assumes you already have a feedback program. What it gives you is the methodology to prove it worked.
Why feedback initiatives stall at the roadmap
Product teams rarely have a feedback shortage. They have a proof shortage.
The typical cycle looks like this: surveys go out, responses come in, themes get tagged, and the most-requested items get added to the backlog. At the next planning cycle, the team points to the feedback volume as justification for a prioritization decision. Leadership asks whether the last feedback-triggered change actually worked. Nobody has a clean answer.
The gap lives between two things that are almost never connected:
What users said: captured in survey tools, NPS comments, and support tickets
What happened in the product afterward: buried in analytics, session data, and feature usage reports
Most teams treat user friction signals as inputs to prioritization and stop there. They never close the loop back to behavior. The result is a feedback program that feels productive but produces no institutional evidence — which means it gets re-litigated at every planning cycle, and the PM has to make the case for feedback's value from scratch each time.
For guidance on how to measure what happens before this loop even starts, see measuring onboarding success. This article picks up where that one ends: after the feedback has been collected, and after a change has shipped.
What tracking feedback impact actually means
Tracking feedback impact is not the same as tracking feedback. The distinction matters because most tools that help teams collect and organise user feedback stop at the collection and categorisation layer. Impact tracking starts after that.
There are three things a product manager needs to hold separately to make this work:
Feedback signal
What users said, a pattern of NPS comments, an in-app survey response cluster, a recurring support ticket theme, etc. The signal is the input that justifies a product decision.
Product response
What the team shipped as a direct result of that signal: a redesigned flow, a new contextual tooltip, a change to the default state of a feature. The response is the intervention.
Behavioral outcome
Whether a specific, pre-named metric moved after the intervention shipped (feature discovery rate, task completion, session depth on the affected flow). The outcome is the evidence.
Most teams track the signal well. Some document the product response. Almost none defines the behavioral outcome in advance and measures it afterward. That third step is what separates a feedback program that informs the roadmap from one that can prove it shaped it.
A four-step methodology for tracking feedback impact
The following steps give product managers a repeatable process for connecting a feedback signal to a measurable behavioral outcome. Each step builds on the previous one. Skipping any of them breaks the attribution chain.
Step 1: Map feedback to a specific product change
The most common reason feedback fails to influence roadmaps is not that decision-makers ignore it. It is that no one created a traceable record connecting a specific piece of feedback to a specific product decision. When that record does not exist, the attribution argument falls apart before it starts.
Building that record requires three habits:
Tag feedback by theme at the point of collection
When a pattern emerges across survey responses or support tickets, it needs a label that travels with it through the planning process. A tag like "reporting feature confusion" is traceable. "UX issues" is not. The more specific the tag, the easier it is to point to it six weeks later when the fix ships and the measurement window opens.
Attach the feedback theme to the ticket or spec
When a product change is scoped, the feedback signal that motivated it should be referenced directly in the ticket or product spec. This is the timestamped link that makes attribution possible. Without it, there is no way to isolate whether a metric moved because of this change or because of something else that shipped the same week.
Record the intervention date
The date a feedback-triggered change goes live is the start of the measurement window in Step 3. Teams that do not record it cannot set a clean before-and-after baseline. A note in the ticket, a tag in the changelog, or a row in a shared tracker all work: the format matters less than the discipline of doing it consistently.
None of this requires a sophisticated system. It requires a shared agreement that feedback-triggered changes are documented differently from feature work that originated internally, and that the link between signal and decision is never left implicit.
Step 2: Define the behavioral metric the change was meant to move
Before a feedback-triggered change ships, the team needs to name one thing: which metric should move if the change works? This sounds obvious. In practice, most teams skip it, and without a pre-defined metric, there is nothing to measure against when the change goes live.
This is the feedback hypothesis, and it has a simple structure:
"Users reported [X]. We shipped [Y]. We expect [Z metric] to move by [timeframe]."
Choosing the right behavioral metric
Not every metric is the right signal for every change. The goal is to match the metric to the specific behavior the change was designed to affect. Some useful starting points:
Activation rate: for changes designed to help users reach their first value moment faster
Feature adoption rate: for changes targeting a specific capability that users were not discovering or using
Task completion rate: for changes to a specific flow where drop-off was identified in the feedback signal
Funnel analysis conversion at a specific step: for changes addressing a reported friction point at a known drop-off stage
Avoid choosing metrics that are too broad to be sensitive to a single product change. If the metric takes six months to move visibly, it will not give the PM the lead time needed to course correct or build the roadmap case.
Setting the measurement window
The measurement window should be defined before the change ships, not after. A 30-day window is a reasonable default for most feature-level changes. Changes to core flows or onboarding sequences may warrant a longer window to capture return-visit behavior. The key is that the window is fixed in advance and expanding it after the fact because the metric did not move is not a measurement discipline, it is rationalization.
Step 3: Measure the delta, not the sentiment
After a feedback-triggered change ships, the instinct for most teams is to check whether the next round of feedback scores higher. That instinct produces a report, not evidence. Sentiment scores are lag measures. By the time they move, the experience that caused the movement is already weeks old.
What the PM needs instead is a behavioral delta: did the specific metric named in Step 2 move, and by how much, relative to the baseline set before the change shipped?
The signals worth measuring
Product analytics data is where the delta lives. The most reliable post-change signals for feature-level interventions are:
Feature adoption rate: the percentage of active users engaging with the specific capability the change was designed to surface
Task completion rate: whether users are completing the flow the change was meant to fix, at a higher rate than before
Session depth on the affected flow: whether users are spending more time in the relevant part of the product, indicating reduced confusion rather than abandonment
Avoid using post-change CSAT or NPS movement as primary evidence. Both measure sentiment at a point in time. Neither tells you whether a specific user behavior changed because of a specific product decision. For a full treatment of how to run your NPS program well, see the Jimo NPS article. This step is about what comes after sentiment.
Closing the loop with data
This is where the methodology moves from spreadsheet to system. Jimo connects behavior-triggered messaging and in-product survey responses directly to downstream feature engagement data, so the correlation between what a user reported and how their behavior changed afterward is visible in one place. Customer Alliance used this approach and recorded a 970% spike in feature adoption following a feedback-triggered product change. See the full picture in Jimo customer stories.
Use behavior metrics and retention insights to track the delta across the measurement window defined in Step 2.
Step 4: Close the loop with the roadmap, not just the user
Most feedback management advice ends at telling the user what shipped. That is necessary, but it is not sufficient. The PM also needs to present the behavioral delta to the roadmap process as documented evidence, or the next planning cycle starts from zero again.
What a feedback impact report contains
The report does not need to be long. It needs to be traceable. Four components are enough:
The feedback signal: what users reported, how many responses carried the theme, and when the pattern was identified
The product response: what shipped, when it went live, and which ticket or spec it is documented in
The behavioral outcome: which metric was pre-named in Step 2, what the baseline was, and what the delta was at the close of the measurement window
The next iteration: what the data suggests the team should do next, whether that is expanding the change, adjusting it, or moving on
This structure turns a feedback program from a voice-of-customer exercise into an evidence trail. Use actionable reports and the Jimo Success Tracker to build and store these reports in a format the roadmap process can reference directly.
Why this step is the one most teams skip
Closing the loop with the user feels like the finish line. An in-product announcement goes out, the ticket closes, and the cycle feels complete. The institutional evidence, the documented link between signal, intervention, and behavioral outcome, never gets written up. At the next planning cycle, the PM is back to making the case for feedback's value without any proof that it worked last time. The report in Step 4 is what breaks that cycle.
What a feedback impact report looks like in practice
Consider a product manager at a B2B SaaS company, 120 employees, running a product-led growth motion. Over three weeks, a cluster of in-app survey responses identifies the same problem: users are not finding the reporting dashboard until late in their trial, often after they have already formed a negative impression of the product's depth.
The PM documents the feedback theme, attaches it to a spec, and ships a contextual tooltip sequence using Jimo that surfaces the reporting dashboard at a specific trigger point in the user journey. The pre-named metric is feature discovery rate for the reporting dashboard. The measurement window is 30 days.
At the close of the window, feature discovery rate on the reporting dashboard has increased by 34%. Task completion within the dashboard is up 21%. The PM brings both numbers to the next roadmap review alongside the original feedback theme, the intervention date, and the baseline. The conversation shifts from "users want better reporting" to "we know what we shipped, we know what moved, and here is what we should do next."
The ILG shift: from feedback as input to feedback as signal
Product-led growth (PLG) treats feedback as an input to the roadmap process. A pattern emerges, a decision gets made, a change ships, and the cycle repeats on a quarterly cadence. The loop is real, but it is slow. By the time feedback influences a product decision and that decision reaches the user, the moment of friction that generated the signal is weeks or months in the past.
Intelligence-Led Growth (ILG) operates on a different premise. Feedback is not an input to the next planning cycle. It is a real-time signal the product responds to at the individual user level, immediately. When a user surfaces friction at a specific moment in the product, the product responds to that signal before the session ends, not before the next sprint.
For the PM, this changes the accountability question. In a PLG model, the question is: did we ship a response to this feedback? In an ILG model, the question is: did the product's response to that signal change this user's behavior, and can we prove it?
Jimo connects the feedback signal to the in-product response and measures the behavioral outcome in one system, without engineering dependency. The full loop, from what a user reported to how their behavior changed afterward, is visible and documented. That is what makes feedback impact tracking a growth discipline rather than a reporting exercise. For more on driving adoption outcomes once the signal has been acted on, see increase product adoption.
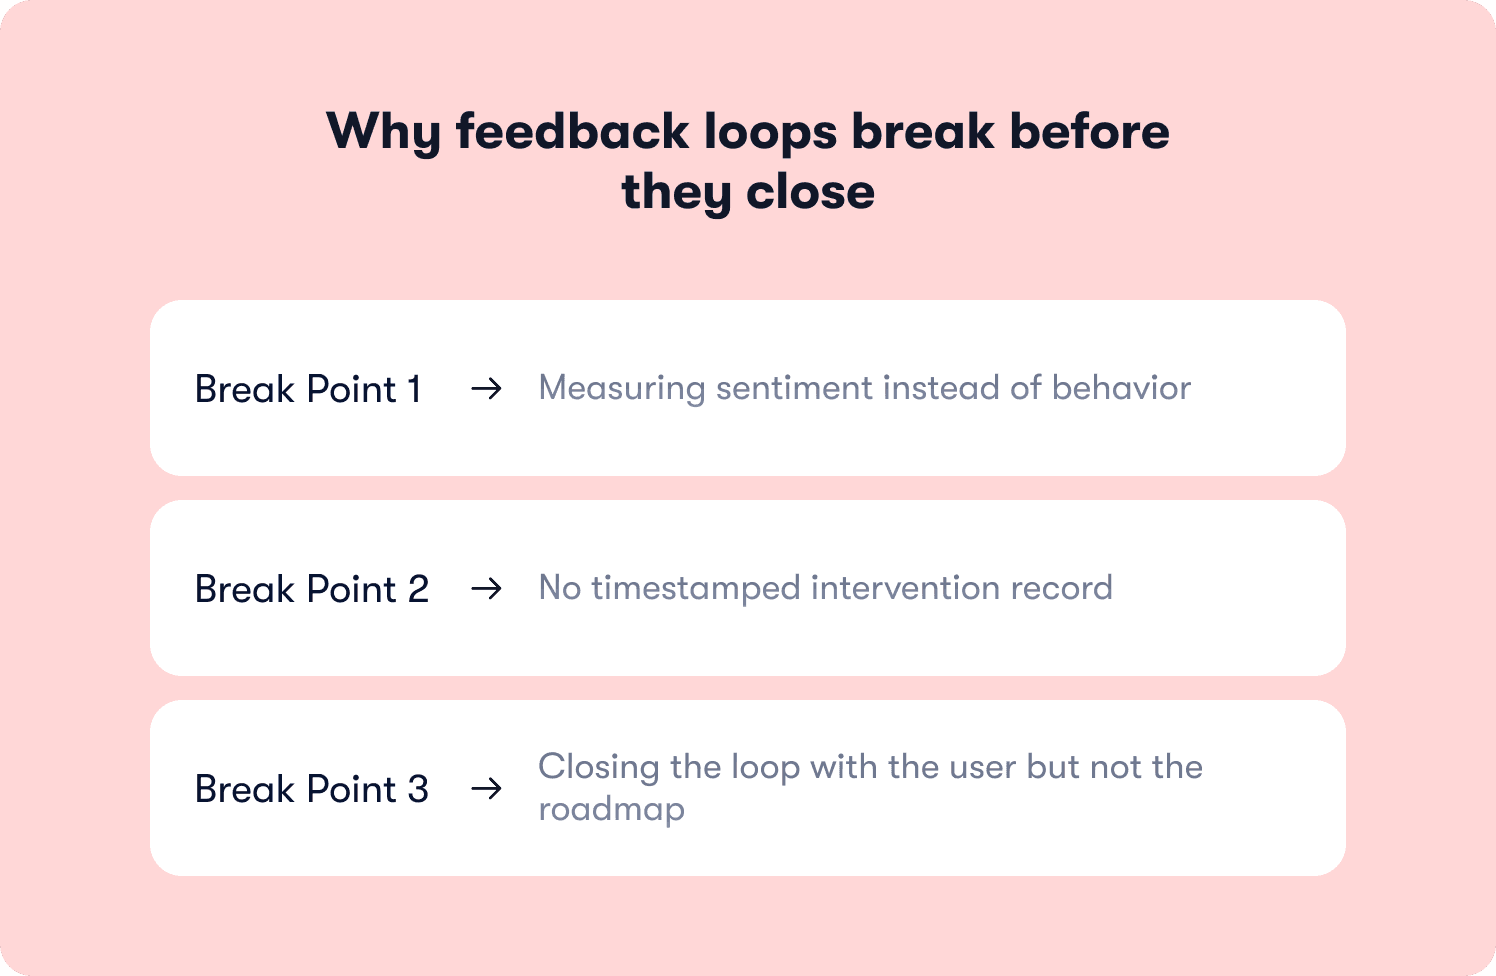
Why most feedback loops break before they close
Even teams that follow the methodology in good faith tend to lose the thread at one of three points. Understanding where the loop breaks is what makes the case for closing it systematically rather than manually.
Break point 1: Measuring sentiment instead of behavior
When post-change CSAT scores improve, it feels like evidence. It is not.
Sentiment tells you how users feel at a point in time. It does not tell you whether a specific behavior changed because of a specific product decision. Teams that rely on sentiment movement as their primary success metric will always struggle at roadmap review, because what they are presenting is a lag measure of perception, not a record of what changed in the product.
The metric that matters is behavioral. Did feature adoption rate move? Did task completion improve on the affected flow? Those are the numbers that hold up.
Break point 2: No timestamped intervention record
Without a documented link between the feedback signal and the product change, the delta measured in Step 3 is not defensible.
Feature adoption rate may have increased during the measurement window. But if the intervention date was never recorded, other variables cannot be ruled out:
A marketing campaign that ran the same week
A pricing change that affected user behavior
A separate product update that shipped in the same release
The attribution argument collapses not because the change did not work, but because the record that would prove it was never created.
Break point 3: Closing the loop with the user but not the roadmap
This is the break point that does the most damage over time.
Teams send an in-app announcement, the ticket closes, and the cycle feels complete. But the behavioral evidence from Step 4 never gets written up. The result:
The PM enters the next planning cycle without proof the feedback program produced a measurable outcome
The case for feedback's value has to be made from scratch, again
The program stays permanently in the position of justifying its own existence
Where the methodology alone is not enough
A manual process, applied consistently, can reduce these break points. It rarely eliminates them. The discipline required across tagging, timestamping, metric pre-naming, and impact reporting is significant. Any one step done inconsistently breaks the chain.
This is where Intelligence-Led Growth changes the accountability model. The question shifts from whether the team followed the right process to whether the product itself responded to the feedback signal, changed the individual user's experience, and produced a measurable behavioral outcome without anyone having to manually assemble the evidence trail.
Jimo connects in-product survey responses directly to downstream behavioral data, so the correlation between what a user reported and how their engagement changed afterward is documented automatically. The loop closes inside the product, not in a planning deck three weeks later.
If you want to see how that works in practice, book a demo.
FAQs
What is the difference between qualitative and quantitative feedback in product development?
Quantitative data tells you what is happening at scale: how many users dropped off a flow, what percentage completed a task, how feature adoption rates changed over time. Qualitative feedback tells you why. User interviews, open-ended survey responses, and customer support interactions surface the reasoning behind the numbers. The most defensible product decisions use both: quantitative data to identify where the problem lives, and qualitative feedback to understand what is driving it.
How should product teams prioritize feature requests from multiple channels?
Start by categorizing feedback based on two dimensions: frequency and business impact. A pain point raised by 40% of users in customer surveys carries more weight than an isolated request, but a single piece of feedback from a high-value account segment may outrank both if it aligns with retention risk. The goal is not to action every piece of customer input but to identify recurring themes that map directly to measurable outcomes on the product roadmap.
What is the most effective way to gather customer feedback without overwhelming users?
Timing and context matter more than volume. A single in-app survey triggered at a specific moment in the customer journey will consistently outperform a long feedback form sent to your entire user base on a fixed schedule. Keep surveys to one or two focused questions, trigger them after a meaningful interaction, and rotate collection across multiple channels so no single user segment carries a disproportionate response burden.
How do you translate raw feedback into actionable insights for the development process?
Raw feedback becomes actionable when it is tagged, grouped, and connected to a specific behavior or outcome. The process has three steps: tag responses by theme at the point of collection, group themes by frequency and affected user segment, and map each group to a metric that would move if the underlying problem were fixed. Customer opinions that cannot be connected to a measurable user need stay in the backlog. Those that map to a clear behavioral gap move to the roadmap.
What is the role of customer sentiment in feedback analysis?
Customer sentiment is a useful directional signal and a poor success metric. It tells you whether user perceptions are improving or deteriorating across the customer experience, which is valuable for spotting emerging trends before they show up in churn data. Where teams go wrong is treating sentiment scores as evidence that a specific product change worked. Sentiment is a lag measure: by the time it moves, the experience that caused the movement is already weeks old. Use it for trend monitoring, not impact attribution.
How do sales and marketing teams benefit from product feedback data?
Customer insights generated through the product feedback process are some of the most credible inputs available to sales and marketing teams. Recurring pain points surfaced in user feedback reveal the language customers use to describe their own problems, which is more reliable than internal assumptions when crafting messaging. Feature adoption data and customer satisfaction scores also help sales teams identify product-qualified leads and prioritize outreach toward accounts showing expansion signals.
How does continuous improvement through feedback support long-term product market fit?
Product market fit is not a milestone, it is a moving target. Customer needs evolve, market demand shifts, and the gap between what users expected when they signed up and what they need six months later is often where churn originates. A consistent feedback process that connects customer behavior to product decisions and measures the outcome of each intervention gives teams the data-driven decision making discipline needed to stay aligned with customer expectations over time, rather than discovering the drift after it shows up in retention metrics.

Level-up your onboarding in 30 mins
Discover how you can transform your product with experts from Jimo in 30 mins

Level-up your onboarding in 30 mins
Discover how you can transform your product with experts from Jimo in 30 mins
Level-up your onboarding in 30 mins
Discover how you can transform your product with experts from Jimo in 30 mins
Level-up your onboarding in 30 mins
Discover how you can transform your product with experts from Jimo in 30 mins
Keep Reading

Product Discovery
In-app surveys: best practices and examples for 2026

Fahmi Dani
Product Designer @Jimo

Product Discovery
The Best NPS Questions to Ask and What to Do with the Answers
Fahmi Dani
Product Designer @Jimo
Product Discovery
10 Best Interactive Demo Software Tools in 2026
Fahmi Dani
Product Designer @Jimo
Product Discovery
In-app surveys: best practices and examples for 2026
Fahmi Dani
Product Designer @Jimo
Product Discovery
The Best NPS Questions to Ask and What to Do with the Answers
Fahmi Dani
Product Designer @Jimo
Product Discovery
10 Best Interactive Demo Software Tools in 2026
Fahmi Dani
Product Designer @Jimo

Product Discovery
6 Best Chameleon Alternatives for Product Tours in 2026
Fahmi Dani
Product Designer @Jimo