/
7 mins read

TL;DR
Most interactive product tours are built to be completed, not to drive activation, and that distinction is where trial-to-paid conversion breaks down. Tours that enforce action-based progression, requiring users to perform the actual task before advancing, are the only format that reliably moves the metrics that matter. Segmenting tours by role, plan, and lifecycle stage prevents the mismatched first experience that kills activation before users ever reach value. Step-level drop-off analytics, not overall completion rate, is the only signal that tells you exactly which step is blocking conversion. Measuring activation lift, time-to-value reduction, and cohort retention for tour completers is the framework that connects tour performance to business outcomes, not just engagement. This article covers eight interactive product tour best practices, a measurement framework for diagnosing where tours fail, and the structural mistakes that prevent tours from moving the numbers that count.
You shipped interactive product tours. Completion rates climbed. Then you opened the activation dashboard and nothing moved.
That's the specific frustration this article is for. Not teams still deciding whether to build tours, but product managers who already did the work, got the data, and are now sitting with a gap they can't explain. Users finish the tour and disappear. They followed every step. They just never did the thing that predicts whether they'll pay.
The problem compounds because it's invisible in the wrong metrics. Completion looks healthy, so it's hard to make the case internally that the tour is broken. But for product managers at scaling B2B SaaS companies, this is not a minor optimization problem. Acquisition spend is committed. Signups are coming in. The activation gap is where that spend either converts into revenue or evaporates. When no one can prove which step blocks conversion, fixing it means guessing.
The root cause is structural. Most interactive product tours move users forward when they click, not when they act. They measure completion, not activation. They're built once, pointed at everyone, and left standing until a UI change breaks them silently. This article covers 8 best practices, concrete examples of what good looks like, and a measurement framework for diagnosing exactly where your tours stop converting.
What Makes an Interactive Product Tour Effective in 2026
Effective is not a completion rate. A tour that 80% of users finish but that doesn't move activation is not effective. It's a distraction that happens to get clicked through.
The metric that matters is activation lift: the percentage of users who complete the specific behavior that predicts whether they'll convert to paid and stay beyond 30 days. That behavior is different for every product. For a project management tool it might be "created first workflow." For a collaboration platform it might be "invited a teammate." The interactive product tour's job is to get users there, not to show them around.
What separates tours that drive activation from tours that just get completed is a single structural difference: action-based progression. Tours that advance when users click "Next" let them move through every step without performing the behavior that creates value. Tours that advance when users complete the task, create the workflow, connect the integration, invite the teammate, enforce the activation event at the moment the tour is designed to produce it. Teams that track this correctly use behavior metrics to see where users drop off versus where they actually activate, not just where they stop clicking.
One-size-fits-all tours compound the problem. A tour designed for an admin looks wrong to a viewer. A tour built for a US enterprise customer creates friction for a European SMB user who has different defaults, different permissions, and a different path to value. Segmentation is not a personalization feature. It's the mechanism that prevents the wrong first experience from killing activation before it starts.
Interactive Walkthrough vs. Product Tour: What's the Difference?
The terms get used interchangeably across tools, sales decks, and product teams, and that ambiguity creates real misalignment between the people building tours and the people measuring whether they work.
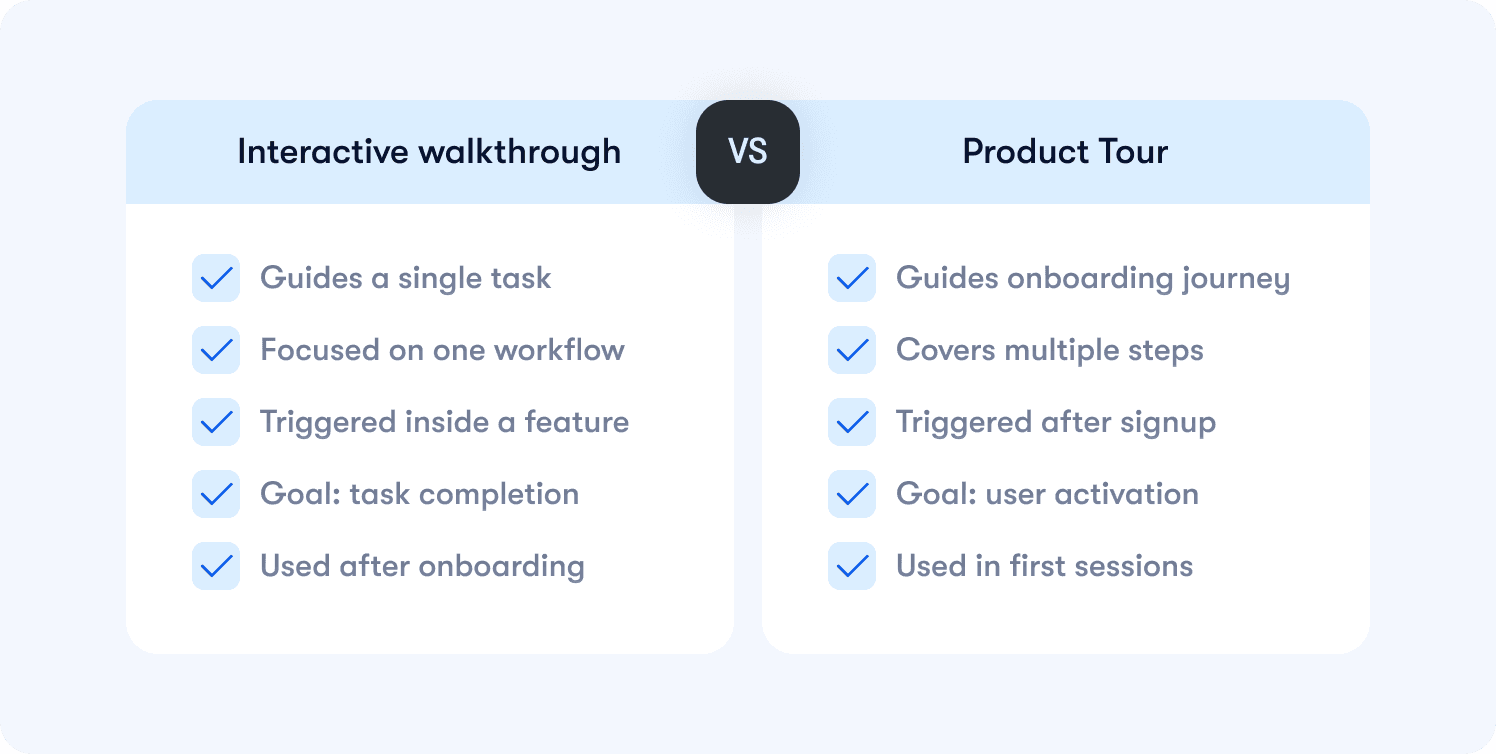
An interactive walkthrough is a step-by-step guide for a specific task. "How to create your first report." "How to connect your CRM integration." It's scoped to a single workflow and typically triggered when a user enters a feature walkthrough for the first time or signals they need help completing a specific action. The goal is task completion, not broad orientation.
A product tour is an onboarding flow designed to guide users from signup to their first activation event. It's broader in scope, triggered early in the user lifecycle, and measured against whether users reach the value moment that correlates with paid conversion and retention. Teams that instrument this correctly pair tour completion with retention insights to validate whether the tour is actually changing downstream behavior.
In practice, both are needed and they serve different moments in the user journey. Tours get users to activation in the first session. Walkthroughs reinforce specific workflows after that, driving feature adoption and expansion. Treating them as the same thing usually means building one experience that does neither job well. The cleaner approach is to define which activation problem you're solving first, then choose the format that fits that specific moment in the user lifecycle.
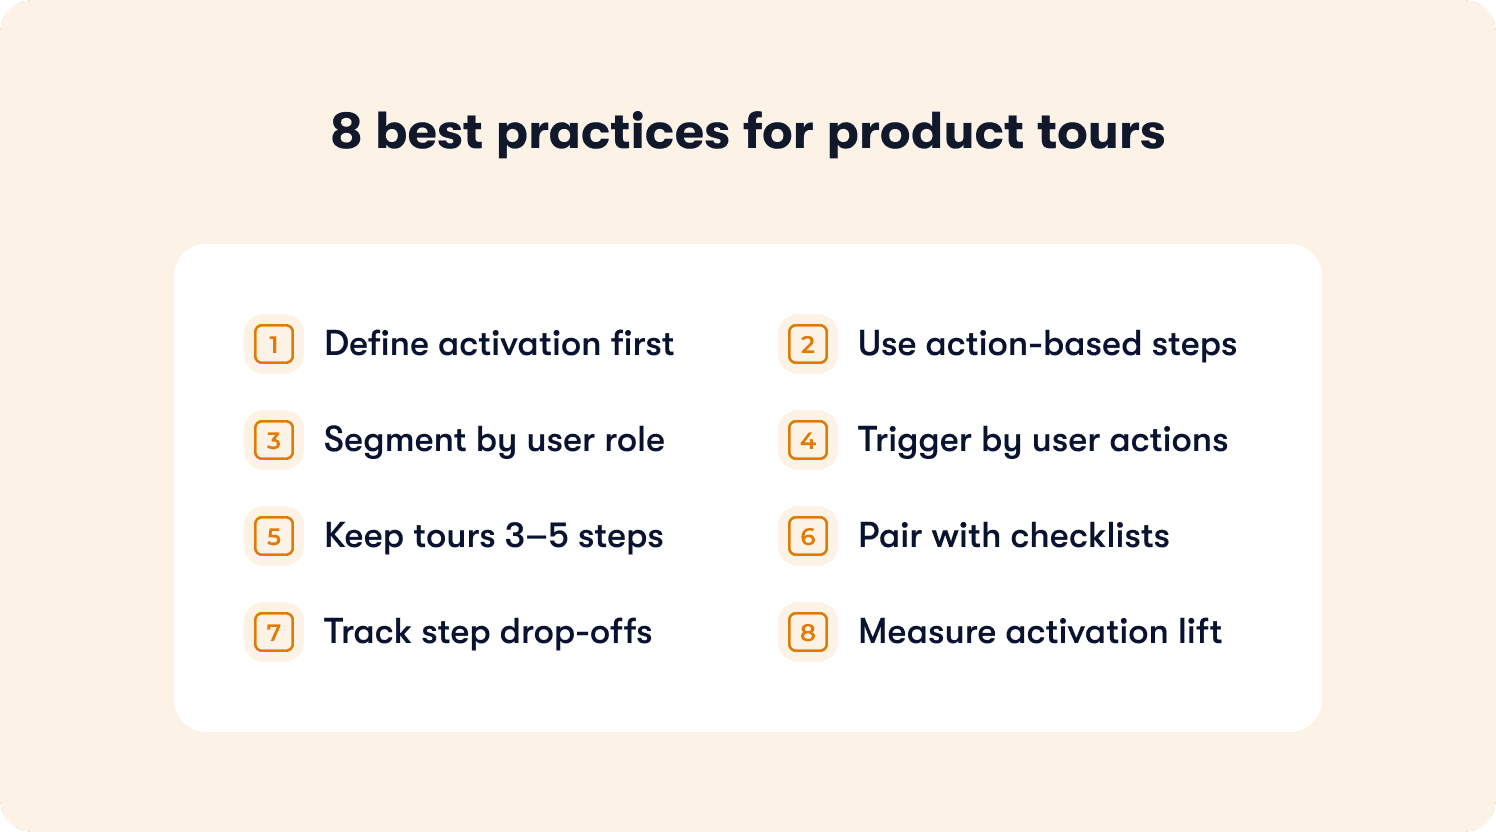
8 Interactive Product Tour Best Practices
The following practices are organized around the activation problems they solve. Each one identifies the breakdown point, explains the mechanism that fixes it, and states the business outcome that changes as a result. Where relevant, concrete examples show what good execution looks like so you can assess which pattern fits the specific drop-off you're trying to fix.
1. Tie Every Tour Step to a Defined Activation Event
Most teams define tour success as completion. The user reached the last step, clicked through every tooltip, and the dashboard shows 100% done. But if that user never created a workflow, never invited a teammate, never connected an integration, they haven't activated. They've just finished a tour.
The fix is mapping each tour step to a specific behavior that predicts whether a user will convert to paid and stay beyond 30 days. Before building a single step, define the activation event first. What is the one action that, when completed in the first session, most reliably correlates with retention? Every step in the tour should exist to move the user toward that action, not to orient them around the product's feature set.
Product managers who instrument this correctly use actionable reports to validate whether tour completers are actually reaching the activation event, not just finishing the flow.
2. Use Action-Based Progression, Not Click-Through
Click-through tours are the single biggest reason completion rates look healthy while activation stays flat. When users can advance by clicking "Next," they will. They'll move through every step without performing the behavior the tour was designed to produce, and your completion data will tell you everything is working fine while your trial-to-paid conversion says otherwise.
Action-based progression requires users to complete the actual task before the tour advances. Create the workflow. Send the invite. Connect the integration. The tour doesn't move until the behavior happens. This closes the gap between tour completion and activation completion, because finishing the tour and reaching the activation event become the same thing.
This is the structural difference that separates interactive product tours that drive conversion from tours that simply get clicked through.
3. Segment Tours by Role, Plan, and Lifecycle Stage
A generic tour is a tour that's wrong for most of your users. An admin and a viewer have different permissions, different workflows, and a completely different path to value. Showing them identical guidance in the first session doesn't standardize the experience. It just guarantees the tour is irrelevant to half your audience before it starts.
Segmentation solves this by triggering different tour flows based on who the user is and where they are in the lifecycle. A free trial user needs to reach activation fast. A team member invited by an existing customer needs to understand their specific role, not the full product. An enterprise admin in a non-English market needs localized guidance that matches their configuration defaults.
Teams that get this right use analytics segments to define the conditions that trigger each tour variant, so every user gets the path to value that actually matches their context.
4. Trigger Tours Based on Real Usage Context, Not Page Load
Tours triggered on page load are the onboarding equivalent of a pop-up ad. They interrupt users who already know what they're doing, frustrate experienced users who've seen the tour before, and surface guidance at the moment it's least relevant. The result is high dismissal rates and a first session that feels like an obstacle course.
Contextual triggering changes the logic entirely. Instead of firing when a user lands on a page, the tour fires when a user opens a feature for the first time, stalls on a step for longer than expected, or reaches a specific point in the onboarding process without completing the activation event. The guidance appears at the moment the user actually needs it, which is the only moment it has a chance of working.
This is the mechanism behind how interactive product tours enhance user engagement: relevance drives completion, and completion drives activation.
5. Limit Tours to 3–5 Steps Maximum
Long tours don't fail because users lose patience. They fail because they're trying to do too many things at once. A ten-step tour is usually a sign that the team hasn't defined their activation event clearly enough. When the destination is fuzzy, every feature feels worth including.
A 3–5 step tour forces a decision: what is the single behavior that predicts retention, and what is the minimum guidance required to get the user there? Everything else gets cut. This constraint produces better tours not because brevity is a virtue, but because it forces the team to prioritize the activation event over the feature showcase. Users who reach value faster convert at higher rates, and shorter tours are the mechanism that gets them there without friction.
6. Combine Tours with Onboarding Checklists and Tooltips
A tour covers the first session. The problem is that most users don't fully adopt a workflow after seeing it once. They complete the tour, close the browser, come back two days later, and can't remember how to do the thing the tour showed them. Without persistent guidance to reference, re-engagement drops and activation stalls across sessions.
Onboarding checklists extend the tour's work beyond the first session by giving users a clear, visible path to activation they can return to at any point. Hints and tooltips reinforce specific workflows inline, surfacing contextual guidance exactly when a user hesitates or enters a feature they haven't used before. Together, they create a guidance layer that supports activation across the full first week, not just the first login.
7. Instrument Step-Level Drop-Off to Isolate Enterprise Friction
When activation stalls, most teams know the tour isn’t converting. What they don’t know is where the breakdown occurs.
In enterprise environments, that ambiguity is expensive. Admins, end users, and power users move through the same feature with different permissions and expectations. A single blocking step can stall adoption across an entire account.
Step-level drop-off visibility isolates the exact moment users hesitate, abandon, or fail to complete an action. Instead of debating whether the feature “resonated,” you can identify whether friction occurred at setup, configuration, or first execution.
For Senior PMs responsible for enterprise rollout, this changes iteration speed. You move from quarterly postmortems to sprint-level corrections. Roadmap time stops being spent on guesswork and starts being spent on the precise interaction that blocked activation.
The goal is not more analytics. The goal is faster diagnosis.
8. Anchor Tours to Activation Outcomes, Not Completion Rates
Completion rate is the metric that allows weak launches to look successful.
If users click through every step but never perform the activation behavior tied to retention or expansion, the tour did not succeed. It simply generated interaction.
For enterprise PMs, this distinction matters. Feature adoption often feeds into QBR narratives, executive reporting, and expansion forecasts. Reporting strong completion without demonstrating activation lift creates false confidence at exactly the wrong level of the organization.
Every interactive tour should be tied to a clearly defined activation event. The question is not “Did users finish the tour?” It is “Did exposure to the tour increase the probability that they completed the activation behavior?”
That shift reframes tours from UX enhancements to measurable adoption levers.
Common Interactive Product Tour Mistakes That Kill Activation
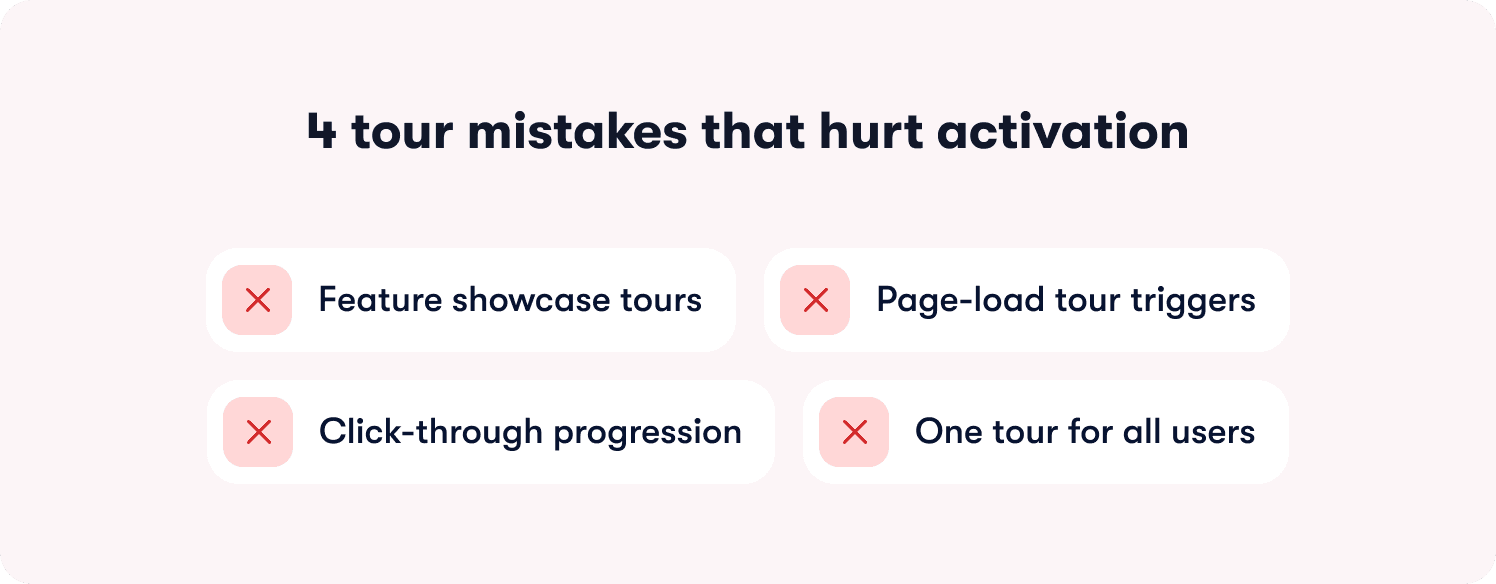
Tour problems rarely announce themselves. Completion looks fine, users aren't complaining, and the dashboard shows healthy engagement. The damage shows up later, in flat activation rates, short trial windows, and churn that happens before CS ever gets involved. These are the four structural mistakes that produce that pattern:
Showcasing features instead of guiding to activation: Feature orientation and activation are not the same goal. A user who has seen every screen but hasn't completed the behavior that predicts retention hasn't activated. They've been given a product overview. Focus every tour on the single action that correlates with paid conversion, and cut everything else.
Triggering tours on page load instead of usage context: Firing guidance the moment a user logs in means it surfaces before they have any context for why it matters. Dismissal rates spike and the tour never gets the chance to do its job. Contextual triggers tied to real behavior — entering a feature for the first time, stalling on a step, reaching a page without completing a prior action — are the only triggers that surface guidance at the moment it's relevant.
Allowing click-through instead of requiring action: If users can advance by clicking "Next" without performing the task, the tour is measuring clicks, not activation. Every tour that allows click-through progression produces completion data that tells you nothing about whether users are reaching value.
Running one generic tour across enterprise roles and permission tiers: Admins, end users, and executive stakeholders enter the product with different context, different authority, and different activation paths. A single flow that ignores those differences creates friction inside accounts that are already complex. Segment-specific guidance is not personalization theater. It is adoption risk management.
How to Measure Interactive Product Tour Success Beyond Completion
Knowing how to measure success of interactive product tours starts with accepting that completion rate is not the answer. It measures whether users clicked through your tour, not whether your tour moved the business outcome it was designed to drive.
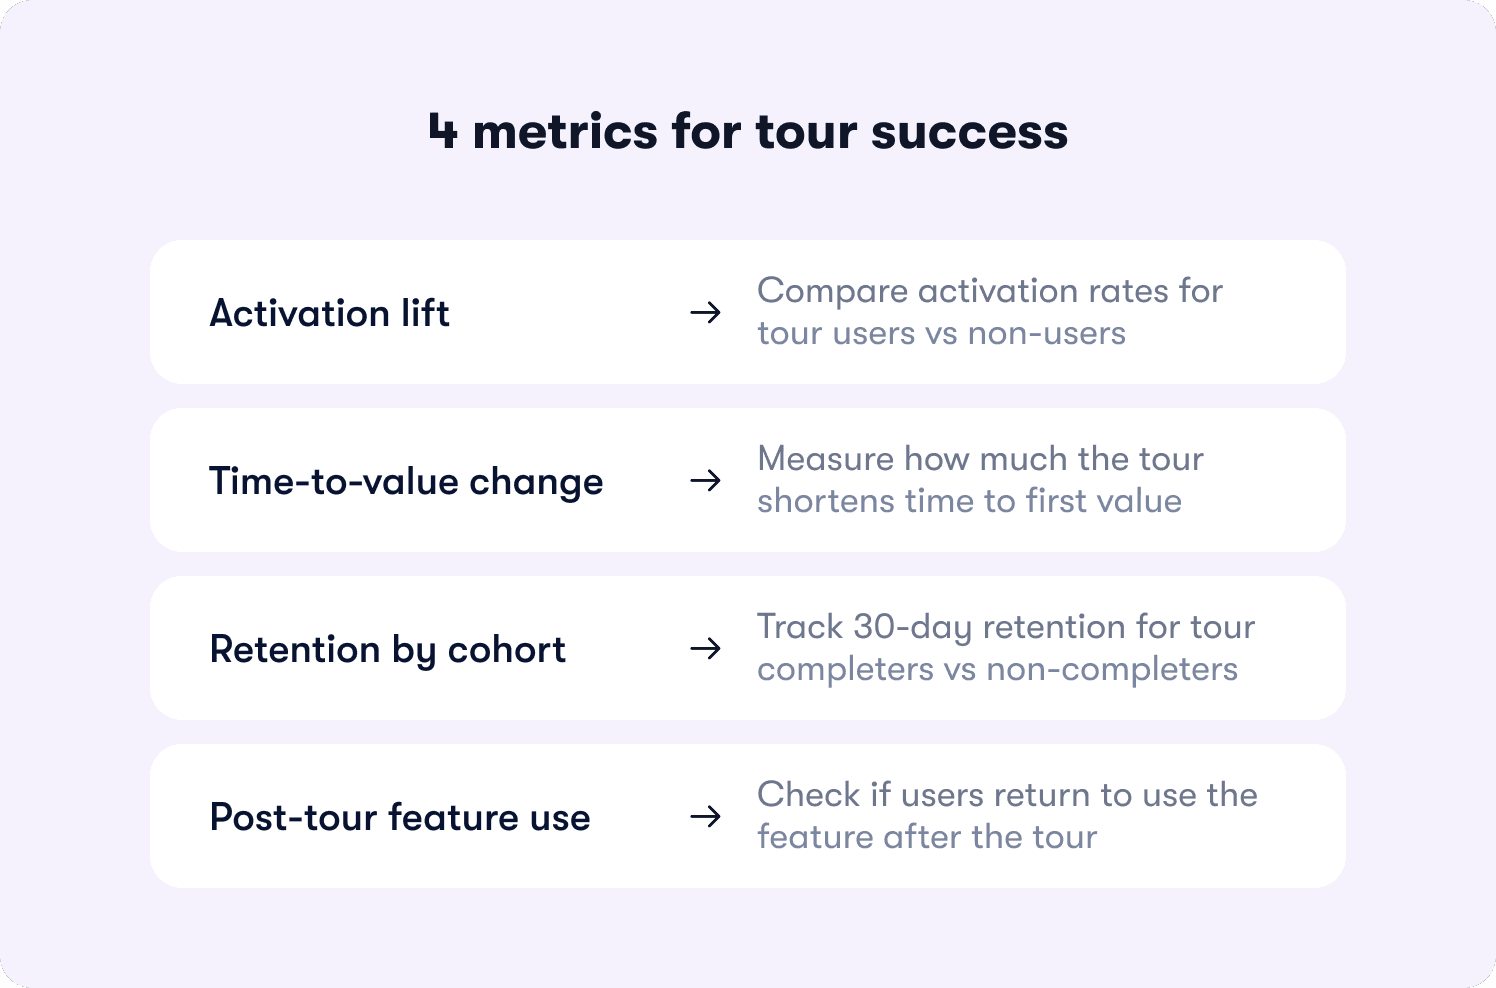
These are the four metrics that actually tell you whether a tour is working:
Activation lift: The percentage of users who complete the defined activation event after the tour, compared to a cohort that didn't receive it. If tour completers activate at a meaningfully higher rate than non-completers, the tour is working. If the gap is small or nonexistent, the tour structure needs to change, regardless of what completion rate says.
Time-to-value change: The average number of days between first login and first activation event, measured before and after the tour launched. A tour that's working shortens that window. One that isn't leaves it unchanged, regardless of how many users finish it.
Cohort retention for tour completers versus non-completers: Compare 30-day retention across both groups. If tour completers retain at a higher rate, the tour is creating lasting behavior change. If retention is similar across both cohorts, the tour may be driving activation without building the habit that keeps users paying.
Feature adoption after the tour: The percentage of users who return to use the feature the tour introduced within seven days of completing it. Sustained feature usage after the tour is the signal that guidance produced a genuine workflow change, not just a first-session exploration.
Pairing this measurement framework with actionable reports gives product teams the step-level visibility to iterate on the specific moments that block conversion, not just the overall flow.
Why Jimo Takes a Different Approach
Most tour tools are built around the same core assumption: give product teams a way to create step-by-step guidance and put it in front of users. The differences between platforms tend to be cosmetic. More templates, slightly different targeting logic, a cleaner editor. The underlying model stays the same: manual creation, linear progression, completion as the success metric.
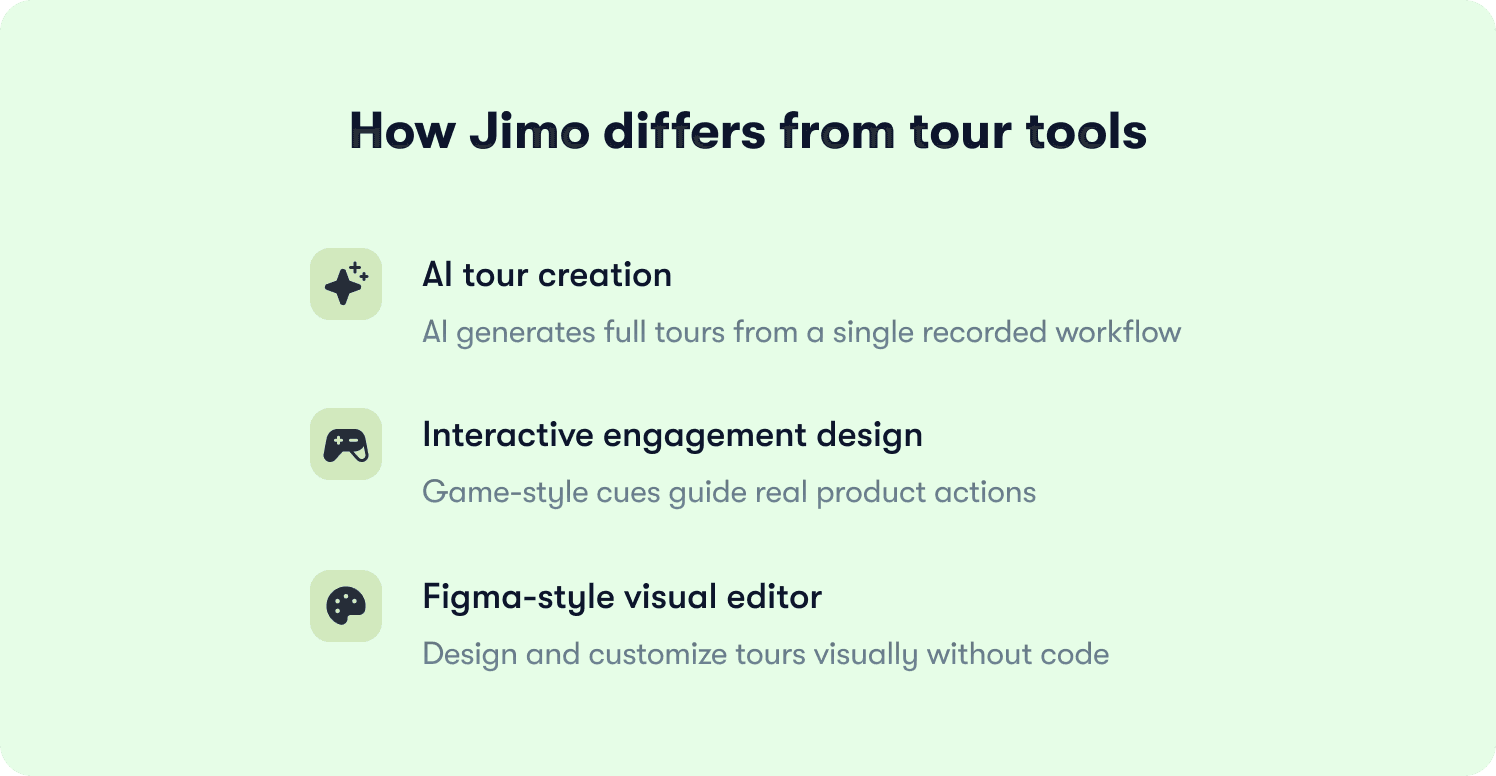
Jimo is built around a different model. Three capabilities in particular separate it from every other tool in the category.
AI-powered tour creation: Jimo is the only platform where AI automatically generates the full tour structure from a single recorded flow. Record your workflow once, and Jimo's AI builds the steps, triggers, and progression logic without manual configuration. Tour creation time drops by more than 90%, which means teams can ship guidance the same week a feature launches and iterate on underperforming tours without a sprint dependency.
Gaming-inspired engagement mechanics: Jimo's interactive tours use cursor animations, interactive highlights, and engagement patterns borrowed from game design. Instead of reading instructions and clicking Next, users follow animated cues, interact with highlighted elements, and learn by doing. The result is up to 40% higher completion rates compared to traditional linear tour tools. No other platform in the category can make this claim.
A Figma-like visual editor: Most tour builders constrain product teams to templates, require CSS for customization, or depend on engineering tickets to produce on-brand experiences. Jimo's editor works like Figma: drag, resize, style, and position any element with full design flexibility, directly in the product, without touching code. Product managers can build on-brand tours in minutes and iterate the same day feedback comes in, with no developer involvement.
These three capabilities address the operational reality that product managers at scaling B2B SaaS companies actually face: not enough time to build tours properly, guidance that users dismiss instead of follow, and a dependency on engineering that slows every iteration cycle. See how teams like Zenchef and ABTasty are applying this in the customer stories, or see for yourself how Jimo can work for you with a free trial.
FAQs
Our tour completion rate is above 70% but trial-to-paid conversion hasn't moved. What's wrong?
Completion rate and activation are measuring different things. A user who clicks through every step without performing the behavior that predicts retention will show up as a completion in your dashboard and a churn risk in your revenue data. The first thing to check is whether your tour uses action-based progression or click-through advancement. If users can reach the final step without creating a workflow, sending an invite, or connecting an integration, your completion data is telling you about clicking behavior, not activation behavior. Audit your tour against your defined activation event and rebuild progression logic so the tour cannot advance until the behavior happens.
How do we identify which specific tour step is killing conversion?
Overall completion rate won't tell you. You need step-level drop-off data that shows exactly where users abandon, where they hesitate before advancing, and where the gap between reaching a step and completing it is widest. That data narrows the diagnosis from "the tour isn't working" to "step three has a 60% abandonment rate and needs to be rebuilt." Without that visibility, every iteration is a guess. Teams that instrument this correctly using actionable reports can identify and fix the blocking step in the same sprint they spot it, rather than waiting for the next quarterly review.
At what point does segmenting tours by role actually move activation, versus adding maintenance complexity for marginal gain?
Segmentation pays off fastest when your user base has meaningfully different paths to value. If an admin and an end-user share the same activation event and reach it through the same workflow, a single tour with minimal conditional logic is defensible. But if their paths diverge, their permissions differ, or the behavior that predicts retention is different by role, a generic tour is actively suppressing activation for at least one segment. The signal to look for is activation rate variance across roles. If one segment activates at significantly lower rates than another using the same tour, segmentation will close that gap faster than any other intervention.
How do we decide what our actual activation event is, rather than defaulting to what feels important?
Start with retention data, not product instinct. Pull your 90-day retained users and identify the behaviors they completed in their first session that churned users did not. The activation event is the behavior with the strongest statistical correlation to retention, not the feature your team is most proud of. For most B2B SaaS products it tends to be a collaborative action: inviting a teammate, connecting a data source, creating a shared artifact, because those behaviors create a structural reason to return. Once identified, every tour step should exist solely to move users toward that single behavior.
We ship product updates weekly. How do we prevent tours from silently breaking every time the UI changes?
Tours built with hard-coded UI selectors break when elements move or get renamed, and teams often don't find out until abandonment spikes in the data. The fix has two parts. First, use a builder that targets elements by behavior rather than CSS class, so tours are resilient to visual changes. Second, build a review step into your release process so that any UI change automatically flags the tours referencing those elements before the update ships. Tours should be maintained with the same discipline as the product itself, and a no-code editor that lets PMs update guidance the same day a change ships removes the engineering dependency that makes that cadence impossible for most teams.
How do we justify rebuilding tours that currently show healthy completion metrics to leadership?
Completion rate is a lagging input metric, not a revenue metric. The argument that moves stakeholders is cohort analysis: compare 30-day retention and trial-to-paid conversion for tour completers versus non-completers. If completion is high but both cohorts retain and convert at similar rates, the tour is consuming resources without driving the outcome it was built for. That comparison, run against your own product data, is more persuasive than any industry benchmark because it's specific to your users and removes the "our product is different" objection before it gets raised.