TL;DR
Product-led growth metrics give VPs of Product a shared, revenue-defensible language for reporting on the product motion to the board, connecting user behavior inside the product to conversion, retention, and expansion outcomes rather than to signups or pageviews alone. This article lays out the core metrics framework worth tracking at the company level, how to build a reporting cadence leadership can act on, and the mistakes that turn a promising PLG dashboard into noise nobody trusts. It stops short of onboarding-flow instrumentation, since that's a narrower, more tactical problem covered elsewhere. The goal here is a measurement system a VP can defend in a board meeting, not a checklist a single team runs in isolation.
A VP of Product walks into a board meeting with a slide full of activation rates, feature adoption curves, and PQL counts. The board asks one question: what does this mean for revenue next quarter? Too often, there's no good answer, because the metrics were built to describe product behavior, not to defend a growth strategy.
That gap is the real problem behind most PLG measurement programs. Teams collect plenty of data on what users do inside the product, but very little of it survives translation into the language a board, a CFO, or a CEO actually cares about. The result is a dashboard that product teams trust and leadership quietly ignores.
This article lays out the product-led growth metrics worth tracking at the company level in 2026: which ones earn a place on a board slide, how to build a reporting cadence around them, and the mistakes that turn a promising metrics program into noise nobody acts on.
Why PLG metrics matter more than traditional SaaS KPIs
Most SaaS leadership decks still lean on marketing-qualified leads, customer acquisition cost, and pipeline coverage. Those numbers describe what sales and marketing are doing. They say almost nothing about whether the product itself is earning its customers.
Product-qualified leads track activated users and their PQL-to-paid conversion rate, giving a VP something MQL volume never could: a direct signal that the product, not a sales rep, moved a prospect toward a purchase decision. That distinction matters more every year the product-led growth model becomes the default rather than the exception in B2B SaaS.
The shift is not cosmetic. When product usage replaces sales activity as the primary growth engine, the metrics a VP reports to the board have to change with it. Revenue growth, net revenue retention, and expansion are increasingly explained by what happens inside the product in the days and weeks after signup, not by how many leads marketing generated last quarter.
That's also where the limits of PLG metrics show up. A dashboard full of activation rates and feature adoption curves tells a VP what already happened. It rarely tells them what to change next, or which lever will move the number this quarter rather than next year. That gap is where intelligence-led growth comes in: layering the same product data with a model of what drives outcomes, so the metrics stop being a rearview mirror and start informing the next decision.
The core PLG metrics framework
Not every number a product team tracks belongs on a board slide. The metrics below are the ones that survive that test: each one ties directly to revenue, retention, or expansion, and each one gives a VP a defensible answer when leadership asks how the product motion is performing.
Metric | What it measures | Why a VP should care |
Activation rate | Share of new users who reach the moment they first experience real product value | The clearest early predictor of trial-to-paid conversion; a stalled activation rate explains a growth plateau better than any acquisition metric |
Time-to-value | How long it takes a new user to reach that same value moment | Directly correlated with conversion speed and CAC payback; a shrinking TTV compounds across every cohort that follows |
Share of users whose in-product behavior signals readiness to buy or expand | Gives sales a warmer, product-verified pipeline instead of a marketing-scored guess, which shortens deal cycles | |
Net revenue retention | Revenue retained and expanded from existing customers, net of churn | The single number most SaaS boards weight above almost any other, since it separates durable growth from leaky-bucket growth |
Expansion revenue | Revenue growth from upsells, seat additions, and cross-sells within the existing customer base | Proves the product can grow accounts without new sales headcount, which changes how a board thinks about scaling costs |
Self-service conversion rate | Share of paid conversions that happen without a sales rep involved | A rising rate is direct evidence that the product motion is working, and it's a number CFOs can tie straight to sales efficiency |
Feature adoption depth | Share of active users engaging with features beyond the core activation event | Signals whether the product is becoming embedded in a workflow or just tolerated, which is the leading indicator for renewal risk |
Seven metrics is a ceiling, not a starting point. A team just building this system should pick three or four that map to their biggest current gap and prove the reporting cadence works before adding more.
If leadership needs one number to anchor the whole framework, net revenue retention is usually it. Every other metric on this list either feeds into NRR or explains a change in it, which makes it a natural north star metric candidate for a board that wants one chart, not seven.
PLG metrics vs. onboarding metrics
These two categories get confused constantly, and the confusion has a cost: teams end up reporting flow-level noise to an audience that needs company-level signal.
PLG metrics answer a strategic question: is the product driving revenue, retention, and expansion across the whole customer base?
Onboarding metrics answer a tactical question: is a specific flow getting users to complete the steps that lead to activation?
A VP reporting to the board needs the first category. A team increasing product adoption inside a single feature or flow needs the second, and that work matters, but it belongs in a different conversation.
For the instrumentation-level view, including how to build activation funnels and set up event tracking for individual flows, see 5 ways to measure user onboarding success. This article stays focused on the company-level system a VP needs to run.
How to build a PLG metrics reporting cadence for leadership
A metrics framework only earns its place on a board slide if someone owns it, reports it on a predictable schedule, and ties it to decisions leadership actually makes.
Without that structure, even a well-chosen metric list turns into a spreadsheet nobody opens between quarters.
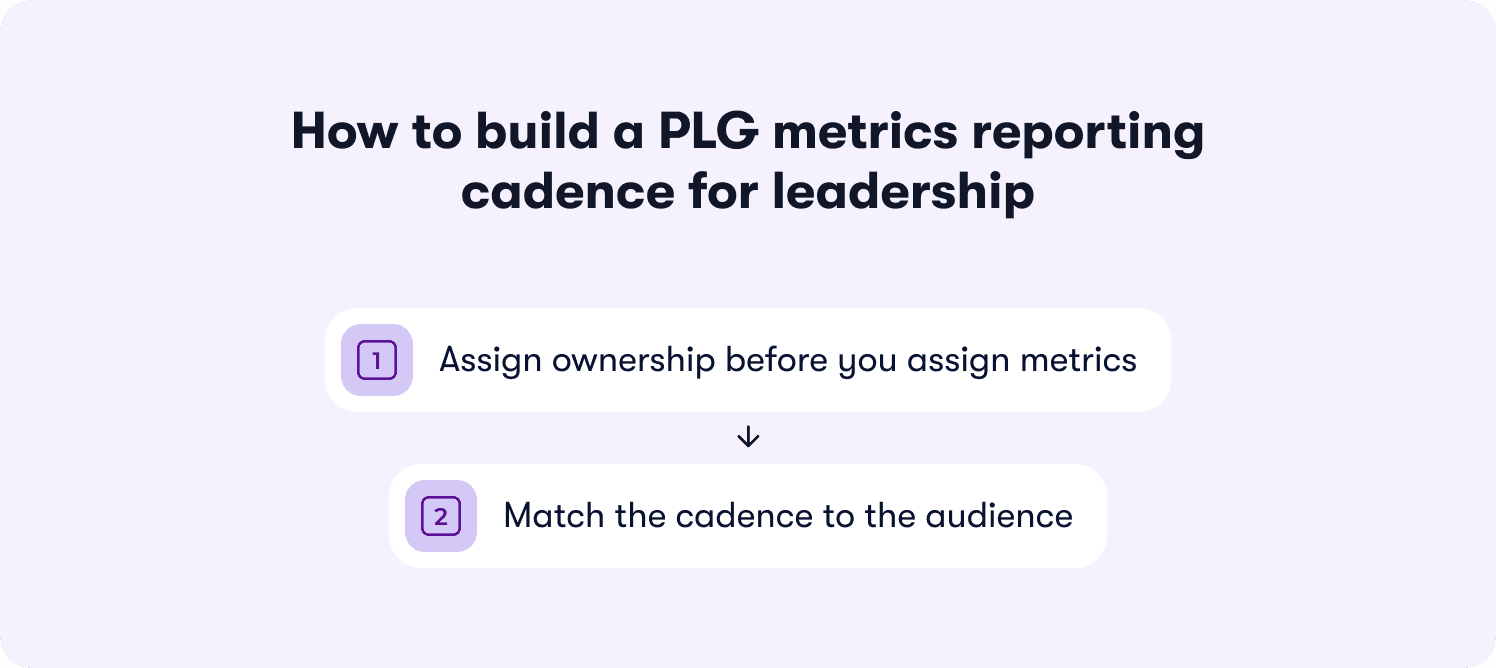
Assign ownership before you assign metrics
Every metric on the list needs a named owner, not a department. A VP of Product might own activation rate and feature adoption depth, while a Head of Customer Success owns net revenue retention and expansion revenue. Shared ownership without a name attached is how metrics quietly stop getting reported.
Match the cadence to the audience
Audience | Cadence | What they need to see |
Board / executive team | Quarterly | Net revenue retention, expansion revenue, activation rate trend |
Cross-functional leadership | Monthly | Full metrics framework, with commentary on what changed and why |
Product team | Weekly | Activation rate, feature adoption depth, PQL rate at the cohort level |
A board doesn't need weekly noise, and a product team doesn't need to wait a quarter to see whether a change worked. Reporting the same seven metrics at the same frequency to every audience is a common way this system breaks down before it delivers value.
Tie metrics to resourcing decisions, not just status updates
The strongest PLG reporting cadence connects each metric to a decision leadership is already making. FairMarkit found that a 25% improvement in activation rate correlated with a 34% increase in revenue, which is the kind of link that turns a metrics review into a resourcing conversation rather than a status update. If activation is the bottleneck, that's an argument for headcount on the activation team. If expansion revenue is flat while net revenue retention holds steady, that's a signal to invest in the motion that turns adoption into upgrades, the same activation-to-expansion link Crossbeam used to justify where to focus their product team's next quarter.
Without that connective tissue, a metrics dashboard stays a reporting exercise. With it, the same dashboard becomes the evidence base for where the next budget cycle goes.
Common mistakes VPs make when tracking PLG metrics
Most PLG measurement programs don't fail from a lack of data. They fail from tracking the wrong things well, or the right things without the structure to act on them.
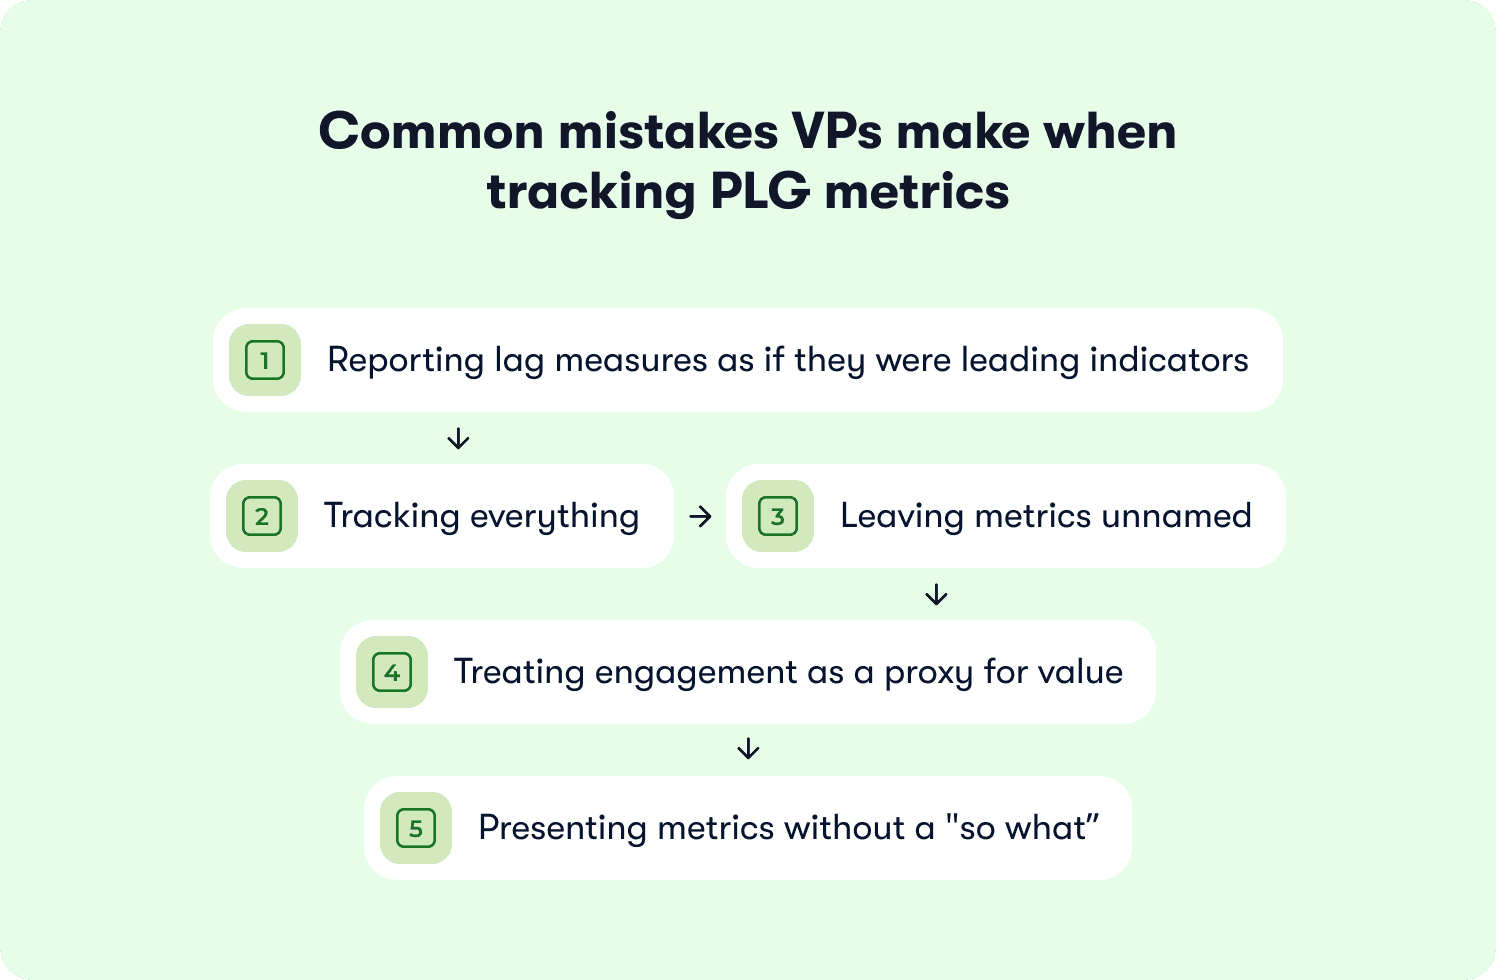
Reporting lag measures as if they were leading indicators. A lag measure like net revenue retention tells you what already happened. It's essential, but on its own it gives a board nothing to act on before the next quarter's number is already locked in.
Tracking everything instead of what moves the board. A dashboard with twenty metrics dilutes attention from the seven that actually predict revenue outcomes. More data does not mean more clarity, and a bloated dashboard is often a sign that no one has decided which numbers actually matter.
Leaving metrics without a named owner. A metric nobody owns is a metric nobody explains when it moves. That's the fastest way for a reporting cadence to quietly stop happening.
Treating engagement as a proxy for value. High session counts or feature clicks can look healthy while retention erodes underneath them. Engagement that doesn't connect to an activation event or a retention outcome is a vanity signal wearing a strategic metric's clothes.
Presenting metrics without a "so what." A chart showing activation rate ticking up 3% means little to a board without the follow-up: what changed, and what should happen next because of it.
That last mistake points to the deeper issue. PLG metrics without an intelligence layer behind them just describe the past. They confirm what happened last quarter without pointing to what will move the number next quarter, which is exactly the gap a purely descriptive dashboard leaves open for a VP standing in front of a board.
Turning PLG metrics into a growth advantage
A metrics framework is only as useful as the decisions it drives. The seven metrics covered here, the reporting cadence built around them, and the mistakes to avoid all exist for one reason: to give a VP of Product a dashboard the board trusts and the product team can act on.
The teams that get the most out of PLG metrics don't stop at measurement. They use the same product data that feeds activation rate and feature adoption depth to identify what to change next, closing the loop between what happened and what should happen now. That's the difference between a reporting exercise and a growth engine. Your product doesn't just sell itself; it activates itself.
Building that system starts small: pick three or four metrics tied to your biggest current gap, assign an owner to each, and set a cadence before adding complexity. The framework scales from there, and it scales faster with the right measurement layer behind it.
FAQs
What are the most important PLG metrics for SaaS in 2026?
Activation rate, time-to-value, product-qualified lead rate, net revenue retention, expansion revenue, self-service conversion rate, and feature adoption depth form the core framework most VPs of Product should report on, though the exact mix depends on where a company's biggest growth bottleneck sits.
What's the difference between PLG metrics and traditional SaaS metrics?
Traditional SaaS metrics like MQL volume and CAC describe sales and marketing activity. PLG metrics measure what happens inside the product after signup and connect that behavior directly to conversion, retention, and expansion outcomes.
How often should PLG metrics be reported to leadership?
Cadence should match the audience: quarterly for board-level metrics like net revenue retention, monthly for cross-functional leadership reviewing the full framework, and weekly for product teams tracking cohort-level activation and adoption data.
Which PLG metric matters most for a board presentation?
Net revenue retention is usually the strongest single anchor, since nearly every other PLG metric either feeds into it or explains a change in it, giving a board one number that reflects the health of the whole motion.