TL;DR
A customer health score is a composite metric that predicts whether an account will renew, expand, or churn, built from four signal categories: product engagement, adoption milestones, support and feedback, and commercial signals. Product usage data (the first two categories) is the earliest of the four to form, often by weeks, which makes it the layer worth watching if you only find out an account is at risk once it's already asking to cancel.
By the time an account tells you they're evaluating other options, that conversation is rarely the first sign of trouble. It's the last one. The support ticket volume, the NPS detractor score, the renewal call that goes sideways: these are all things a customer has to actively tell you before you know something's wrong. Product usage data doesn't wait for the customer to say anything. It's already showing the disengagement weeks before any of those other signals fire, if anyone's actually watching it as a leading indicator instead of a dashboard nobody checks until QBR prep.
That gap, between when the churn risk is actually forming and when a CS team typically hears about it, is the whole problem with reactive health scoring. Closing it starts with product usage data because it's the earliest layer available.
That math matters beyond any single account. Bain & Company's research puts the cost of acquiring a new customer at five to 25 times the cost of retaining an existing one, and finds that a 5% improvement in retention rate can lift profit by 25% to 95%, depending on the industry. For whoever owns the health score, that's the real stake in catching risk weeks earlier instead of at the cancellation call: it's the difference between an intervention that costs a CS rep an afternoon and a win-back campaign that may not work at all.
What a customer health score actually aggregates
A customer health score is a composite metric that aggregates multiple product and engagement signals into a single number representing how likely a customer is to renew, expand, or churn. The important word is predictive: a good health score doesn't report on what already happened, it estimates what's likely to happen next based on the behavioral patterns that historically precede renewal or departure.
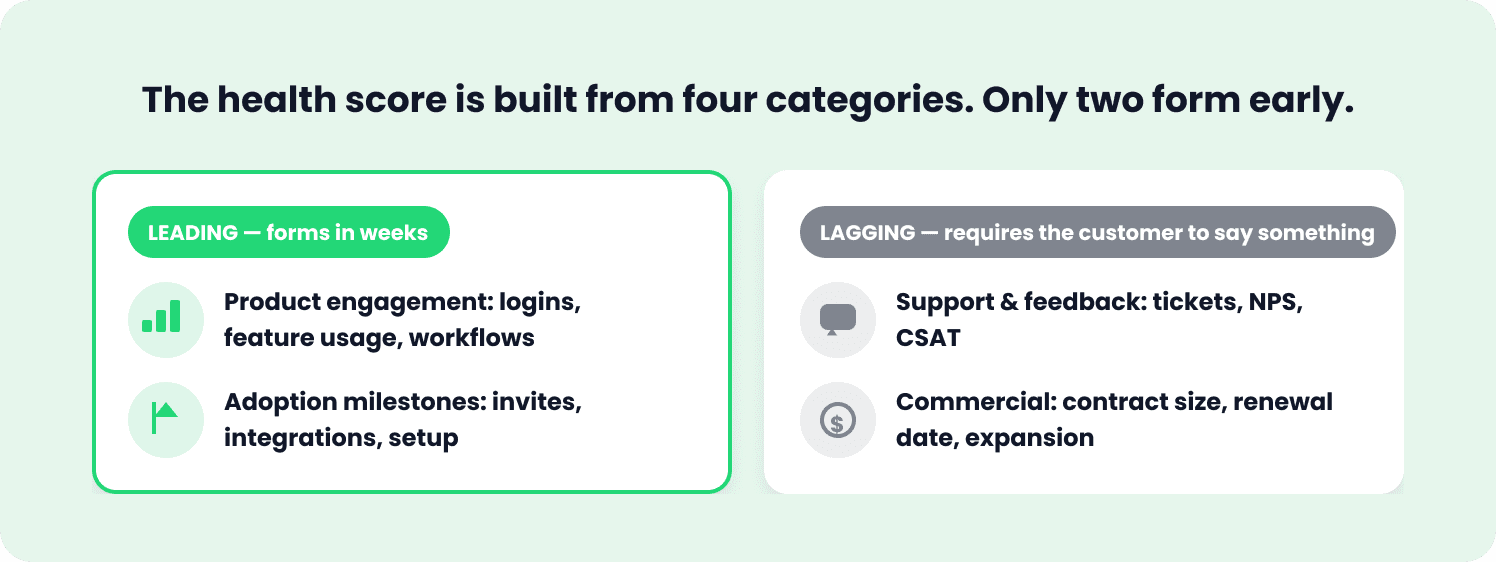
That composite score is typically built from four signal categories:
Product engagement signals: login frequency, feature usage breadth, workflow completion rates
Adoption milestones: teammate invitations, core workflow completion, tool integrations, the same events covered in how to measure product adoption end to end
Support and feedback signals: support ticket volume, NPS responses, CSAT scores
Commercial signals: contract size, renewal date proximity, expansion activity
Categories three and four are lagging by nature: a customer has to notice a problem, decide it's worth flagging, and take the action of telling someone, before that signal exists in your system at all. Categories one and two are the leading half of the same leading vs. lagging split. They're different. A power user who stops opening a key workflow, an admin who never finishes setup, a team whose weekly session count quietly drops by a third: none of that requires the customer to say anything. It's happening in the product regardless of whether anyone tells CS about it, which is exactly what makes product usage data the earliest layer a health score can draw from.
What at-risk looks like in usage data before it looks like anything else
A handful of patterns show up in product engagement and adoption-milestone signals well before they show up anywhere in a team's view of an account.
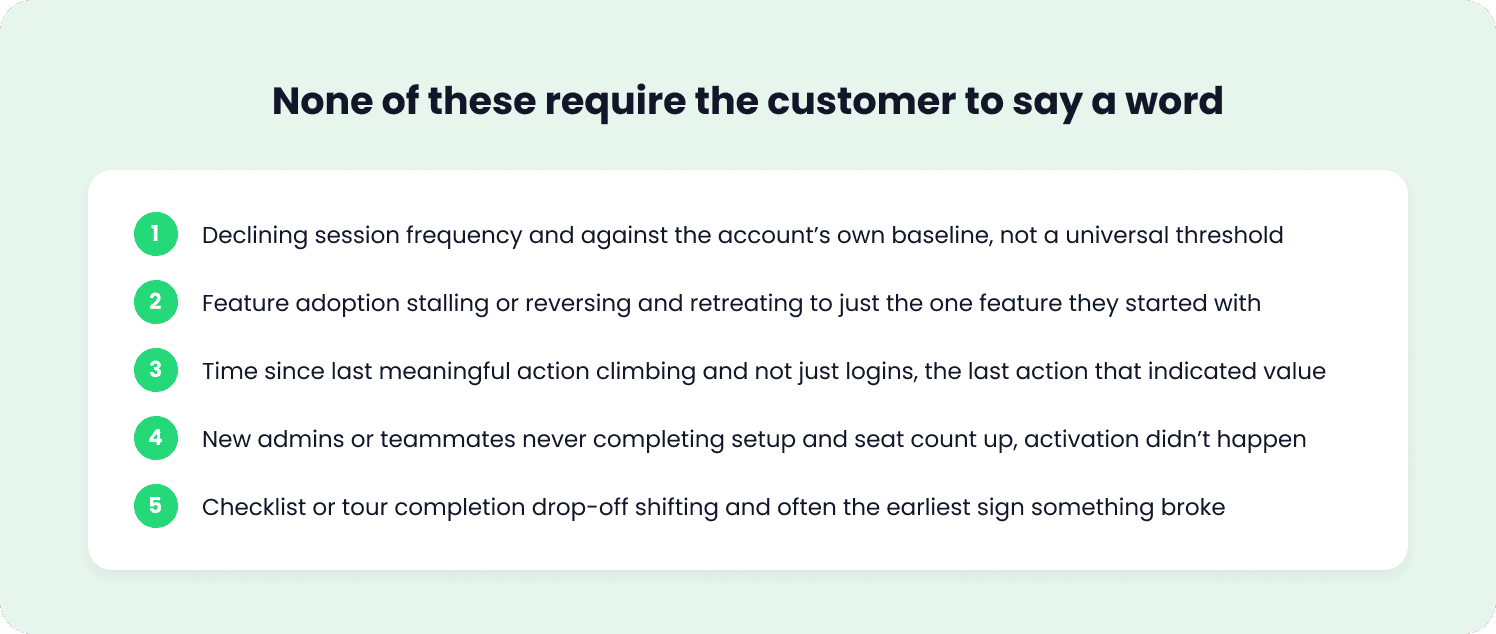
Declining session frequency
Not a single quiet week, which is normal, but a sustained downward trend against that account's own baseline. The comparison that matters is the account against itself over time, not against some universal engagement threshold that doesn't account for how differently teams use the same product. Jimo tracks session frequency at the account level directly, and framing it at the DAU/MAU level, the same diagnostic used for spotting declining daily active users more broadly, is what separates a real stickiness signal from noise.
Feature adoption stalling or reversing
An account that was expanding into new parts of the product and then stops, or worse, retreats to using only the one feature they started with, is telling you something a support ticket never will: the product isn't earning more of their workflow, and probably isn't earning renewal enthusiasm either.
Time since last meaningful action climbing
Logins alone are a weak signal, since plenty of disengaged users still open the product out of habit without doing anything in it. The more useful version of this metric tracks the gap since the last action that actually indicates value, not the last login.
New admins or teammates never completing setup
When an account expands its seat count and the new users never make it through onboarding, that's an early expansion risk masquerading as a good-news event: the seat count went up, but activation, the behavior that actually predicts renewal, didn't happen for them.
Checklist or tour completion drop-off shifting
A sudden change in how far new users get through onboarding, especially after a product change, is often the earliest available signal that something in the experience broke, well before it turns into a support ticket queue.
Each of these is available well before a customer decides to say anything out loud, which is the entire point.
Put two of them together and the picture gets sharper than any single signal on its own. A team whose session frequency has dipped 20% but whose feature adoption is still expanding is probably going through a quiet period, a slow month, someone out on leave, nothing to act on yet. The same 20% session dip paired with feature adoption flatlining and the original onboarding admin no longer showing up in the activity log is a different account entirely, and it's one worth a CS check-in well before the renewal date shows up on anyone's calendar.
What this looks like on a real account
Take a mid-market account, 60 seats, that's been a customer for eighteen months. Nothing about their support ticket history looks unusual: two tickets in the last quarter, both resolved quickly, nothing flagged as urgent. Their last NPS response, three months ago, was a 7, a passive score but not an alarming one. On paper, via the lagging signals, this account looks stable.
In the usage data, a different story has been forming for six weeks. Weekly active seats have dropped from 45 to 28. The one workflow that made this account renew last year, a reporting feature three different stakeholders used weekly, hasn't been touched in seventeen days. Two of the three original power users haven't logged in for over two weeks.
None of that has produced a support ticket, because nobody's stuck on anything; they've quietly stopped showing up. By the time this account's renewal conversation happens in ten weeks, the CS rep walking in cold would be working from a "stable" account profile that's six weeks out of date. A CS rep with visibility into the usage trend has ten weeks of runway to find out why the reporting workflow got dropped and fix it before the renewal conversation ever starts.
From signal to action
Spotting the pattern is only useful if something happens because of it. This is where usage data stops being a report and starts being an early-warning system, and it's a point Jimo's own glossary makes directly: a health score earns its value by triggering action.
Behavior-based segmentation groups accounts by the pattern they're showing (declining frequency, stalled adoption, unfinished setup) and triggers something proportionate to the risk, whether that's an internal alert to the CS owner before the next scheduled check-in, or a behavior-triggered message aimed at re-surfacing the workflow the account stopped using, timed to the moment the drop-off actually happened rather than whenever the quarterly review gets to it.
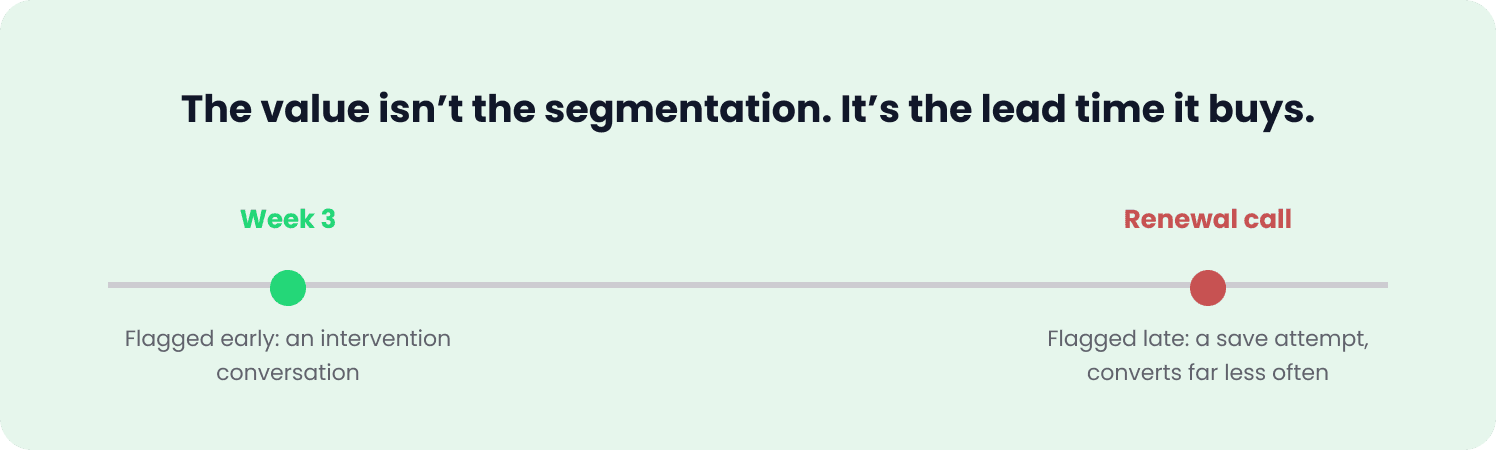
The value isn't the segmentation itself, it's the lead time it buys. An account flagged three weeks into a usage decline is an intervention conversation. The same account flagged after a renewal-stage red flag is a save attempt, and save attempts convert far less often than interventions do, because by then the decision is usually already forming.
The trigger doesn't need to be dramatic to be useful. Often the most effective response to an early usage dip is the least CS-intensive one: an in-product nudge that resurfaces the specific workflow the account stopped using, timed to fire the moment the drop-off crosses a threshold, with no human review required before it goes out. That handles the large volume of accounts where the disengagement is a discoverability problem.
It also means the accounts that do get escalated to a CS rep for a real conversation are the ones where a human conversation is actually the right tool, not the accounts where a well-timed prompt would have solved it on its own. Reserving CS attention for the cases that need it is as much a part of acting on the signal as the alert itself.
This is the retention half of what Jimo calls Intelligence-Led Growth elsewhere: AI-driven personalization that reads individual account behavior in real time instead of running a static, scheduled sequence. The version most people hear about is onboarding. Applied to an existing account instead of a new signup, it's the same read-and-respond mechanism, aimed here at catching a health signal weeks before a lagging one would.
Where this fits alongside the rest of a health score
It's worth being direct about what this is and isn't. Product usage data covers two of the four categories in the framework above: the earliest-forming ones, not the whole score. Support sentiment, financial signals like payment friction or contract terms, and the strength of the relationship with a champion inside the account still matter and don't show up in usage data at all.
A usage-only score will miss a financially struggling account that's still logging in out of habit, or a champion who left the company last week. Stated once, plainly: this is the earliest layer of the composite score.
What usage data adds that the other three can't is speed. It doesn't require the customer's cooperation to generate a signal, and it moves in real time instead of on a survey or renewal-call cadence, which is what closes the weeks-to-days gap between when risk actually starts and when CS finds out.
That speed is also why a usage-decline flag should raise an account's priority for review rather than reclassify it red on a dashboard automatically. The accounts worth watching most closely are the ones where a usage decline shows up alongside even one lagging signal: a slipping NPS score, a frustrated-tone support ticket, a champion gone quiet in QBR prep.
The lead time is the point
The pattern behind "we only find out an account is at risk once they're already asking to cancel" isn't that the warning signs didn't exist. It's that the signals CS teams were watching all required the customer to volunteer them first. A behavioral health score built from usage data doesn't have that requirement, which is the entire reason it's worth adding as a layer rather than waiting on the other three to catch up. Jimo tracks the product engagement and adoption-milestone layer directly and routes it into segmented, behavior-triggered alerts and nudges, the execution step that a product usage analytics tool alone typically stops short of.
Book a demo to see it running against your own usage data, or check the pricing page for growth plan details.
FAQs
What is a customer health score, and what does it measure?
A customer health score is a composite metric that aggregates product and engagement signals into a single number predicting how likely a customer is to renew, expand, or churn. It's predictive rather than descriptive: it estimates what's likely to happen next, not only what already happened.
What are the four signal categories in a customer health score?
Product engagement (login frequency, feature usage breadth, workflow completion), adoption milestones (teammate invitations, core workflow completion, integrations), support and feedback (ticket volume, NPS, CSAT), and commercial signals (contract size, renewal proximity, expansion activity).
Why is product usage data a leading indicator instead of a lagging one?
Support tickets, NPS responses, and commercial signals all require the customer to notice a problem and actively tell someone before the signal exists in your system. Product usage data doesn't wait on that: a drop in session frequency or stalled feature adoption shows up in the product regardless of whether the customer says anything.
What usage patterns indicate an account is at risk before it shows up anywhere else?
Declining session frequency against the account's own baseline, feature adoption stalling or reversing, a growing gap since the last meaningful action, new admins or teammates never completing setup, and shifts in checklist or tour completion. Two of these appearing together is a stronger signal than any one alone.
Can product usage data replace the rest of a customer health score?
No. It covers the earliest-forming two of the four categories, not the whole score. Support sentiment, financial signals, and champion strength inside the account still matter and don't show up in usage data. A usage-decline flag should raise an account's priority for review, not replace the other three categories.