TL;DR
Traditional analytics platforms excel at measuring feature adoption but can't deploy fixes without engineering. User onboarding tools can intervene in-app but lack built-in funnel tracking, forcing teams to stitch together multiple platforms. This guide ranks 14 tools by how well they bridge this insight-to-execution gap. Jimo tops the list because its Success Tracker shows exactly where users abandon features, while auto-progress tours let you deploy contextual guidance that responds to real user actions. The best product analytics tools for adoption tracking are ordered by intervention capability first, analytics depth second, setup speed third.
Your analytics dashboard shows 60% of users drop off during team invite setup. You can see the friction. You just can’t fix it.
After digging through session replays, you realize the “Invite team” button is buried in settings. So you open a ticket. It gets prioritized behind roadmap work. Two sprints later, you ship a prompt, but by then, trial users have churned and expansion never materialized.
This is the real adoption gap in 2026. Most product analytics tools tell you where users drop off. They don’t help you intervene when it happens. Insight lives in one tool but in-app action requires another. And it usually involves engineering.
The best platforms now close both gaps. They connect behavior to intervention inside the same system. You identify a bottleneck, deploy contextual guidance the same day, and measure whether activation improves, all without sprint dependency.
This guide compares tools not just on analytics depth, but on their ability to turn adoption insight into immediate in-product action. Because when activation stalls, revenue stalls with it.
What is product analytics for adoption tracking?
Adoption tracking measures how users progress through meaningful value milestones, from sign-up, to account setup, to first value, to repeat use. It's proving which users reach outcomes that predict retention through data analysis, customer behavior patterns, and understanding how users behave across your product.
Usage tracking tells you “500 users clicked the export button.” Adoption tracking tells you “users who complete data import within 48 hours have three times higher Day 30 retention.”
The business impact shows up in three metrics:
Activation: Which onboarding steps convert trial users to active accounts
Retention: Which feature combinations predict users who stay past 90 days
Revenue: Which adoption patterns lead to expansion or renewal
Teams that don’t use adoption tracking base roadmap decisions on opinions, not outcomes. With it, you know which work drives revenue and which work doesn't.
How to choose the right product analytics for adoption tracking platform for your business?
Most product teams evaluate analytics tools by comparing feature lists. They check pricing tiers. They ask, “Does it have funnels?” None of that matters if the tool can't help you act on what the data shows.
Use these four questions to eliminate poor-fit platforms.
Does it connect onboarding analytics to in-app interventions?
If users drop off at step four of onboarding, can you deploy a tooltip or guided tour to fix it without engineering? Or does the analytics tool just show you the problem while you wait two weeks for dev resources?
If a tool tracks adoption but can’t trigger in-product action, it stops at insight. The bottleneck remains untouched.
Can product teams tag events without engineering?
If adding a new tracking event requires a developer, your roadmap speed drops to your engineering backlog speed. Look for platforms where PMs can define conversion actions, tag feature usage, create onboarding checklists, and set up funnels without sprint dependencies.
Does it measure adoption by segment and lifecycle stage?
“Overall activation rate" isn't useful. You need to see:
Trial users vs paid accounts
Enterprise vs SMB
First-time users vs power users
Segment-level data tells you which adoption patterns predict revenue and which don't.
Does it show where users stall post-onboarding?
Most teams focus on onboarding drop-off. The bigger problem is users who complete onboarding but never adopt core workflows. Your analytics platform should surface post-activation stalls. These are the users who hit their first value moment but never return for the second one.
Does it integrate with your existing stack?
Look for platforms that enable seamless data flow from your existing analytics infrastructure, potentially integrating with your customer data platform, and add the intervention layer on top.
An overview of the leading product analytics platforms for adoption tracking
This comparison prioritizes tools by their ability to act on adoption bottlenecks in-app first, then analytics depth, then setup ease, matching the exact decision framework mid-market B2B SaaS teams use when adoption is bleeding revenue. All intervention-capable platforms appear first because measuring usage without fixing it doesn't move KPIs, followed by analytics-only tools for teams already solving guidance elsewhere.
Tool Name | Best for | In-app intervention | Analytics depth | Setup ease |
|---|---|---|---|---|
Jimo | Loop-in adoption with execution | ✅ | Deep | Fast |
Pendo | Enterprise analytics + guidance | ✅ | Deep | Difficult |
Product Fruits | Budget-friendly onboarding | ✅ | Moderate | Fast |
Userpilot | Analytics + onboarding combined | ✅ | Moderate | Fast |
Gainsight PX | CS-integrated product experience | ✅ | Moderate | Moderate |
Appcues | Mid-market SaaS onboarding | ✅ | Basic | Fast |
Chameleon | Design-driven customization | ✅ | Basic | Fast |
Userflow | Fast web-app deployment | ✅ | Basic | Fast |
Whatfix | Enterprises wanting AI insights | ✅ | Moderate | Difficult |
WalkMe | Enterprise multi-app workflows | ✅ | Moderate | Difficult |
Mixpanel | Event-based behavioral analytics | ❌ | Deep | Moderate |
Amplitude | Predictive analytics & experimentation | ❌ | Deep | Moderate |
Heap | Autocapture & retroactive analysis | ❌ | Deep | Moderate |
PostHog | Open-source product analytics | ❌ | Deep | Moderate |
14 best product analytics tools for adoption tracking
Each tool below includes verified strengths, documented limitations, and specific use cases so you can skip demos with platforms that won't hit your adoption metrics.
1. Jimo — Best Overall for Connecting Onboarding Analytics to In-App Interventions
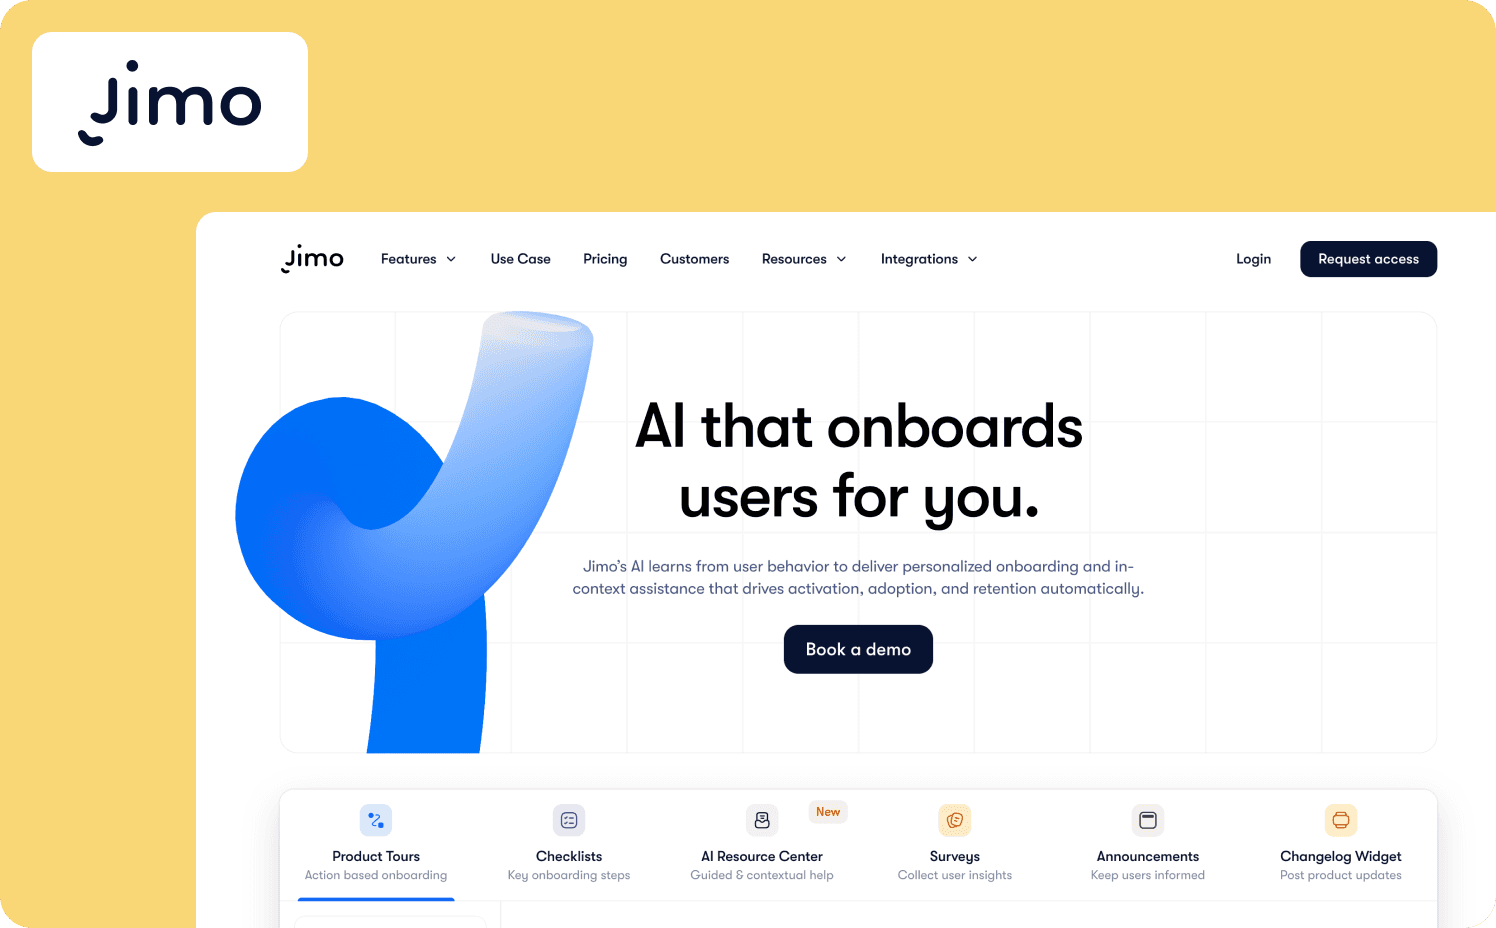
Jimo is the AI-native digital DAP built specifically for complete loop execution from analytics insight to deployed intervention in the same afternoon. It combines no-code Success Tracker (tag any feature, set goals, view drop-offs) with Product Tours (action-based contextual onboarding), Hints (smart inline tips), and AI Resource Center (searchable help hub with AI-driven assistance).
Strengths:
Success Tracker provides no-code feature usage analytics with step-by-step drop-off visualization: Jimo's built-in analytics lets non-technical teams track feature adoption and user progression without developer involvement.
AI-powered tour generation cuts build time by 90%+: Jimo automatically generates complete product tours — including steps, triggers, and progression logic — after recording a flow once. PMs can launch contextual onboarding in minutes instead of manually configuring each step.
Auto-progress logic builder advances tours based on actual user actions, not clicks: Jimo's logic builder automatically progresses tours when users complete the actual task being taught, eliminating unnecessary bottlenecks and ensuring users learn by doing rather than passive reading.
Figma-like visual editor enables on-brand iteration without engineering: Jimo’s drag-and-drop editor allows teams to design, resize, and position elements with full flexibility. PMs can adjust experiences the same day they identify a drop-off, keeping adoption programs agile.
Proactive hints deliver zero-click contextual help at the moment of need: Rather than waiting for users to search help docs, Jimo's smart hints and tooltips appear automatically when users hover over complex features or encounter friction points, providing just-in-time guidance that prevents users from ever leaving their workflow.
Limitations: Jimo is not ideal for mobile-first products as it focuses on web applications rather than iOS and Android.
Best for: Product-led B2B SaaS teams (10-500 employees) that need to track adoption metrics and deploy guidance independently without sprint dependencies. Ideal for product ops managers, customer success, and growth teams prioritizing speed-to-intervention over analytics depth or multi-app complexity. Not suited for enterprises needing cross-application guidance.
Starter: $449/mo (2,500 monthly active users (MAUs))
Growth: $824/mo (2,500 MAUs)
Enterprise: Custom
2. Pendo — Best for enterprises wanting analytics and guidance
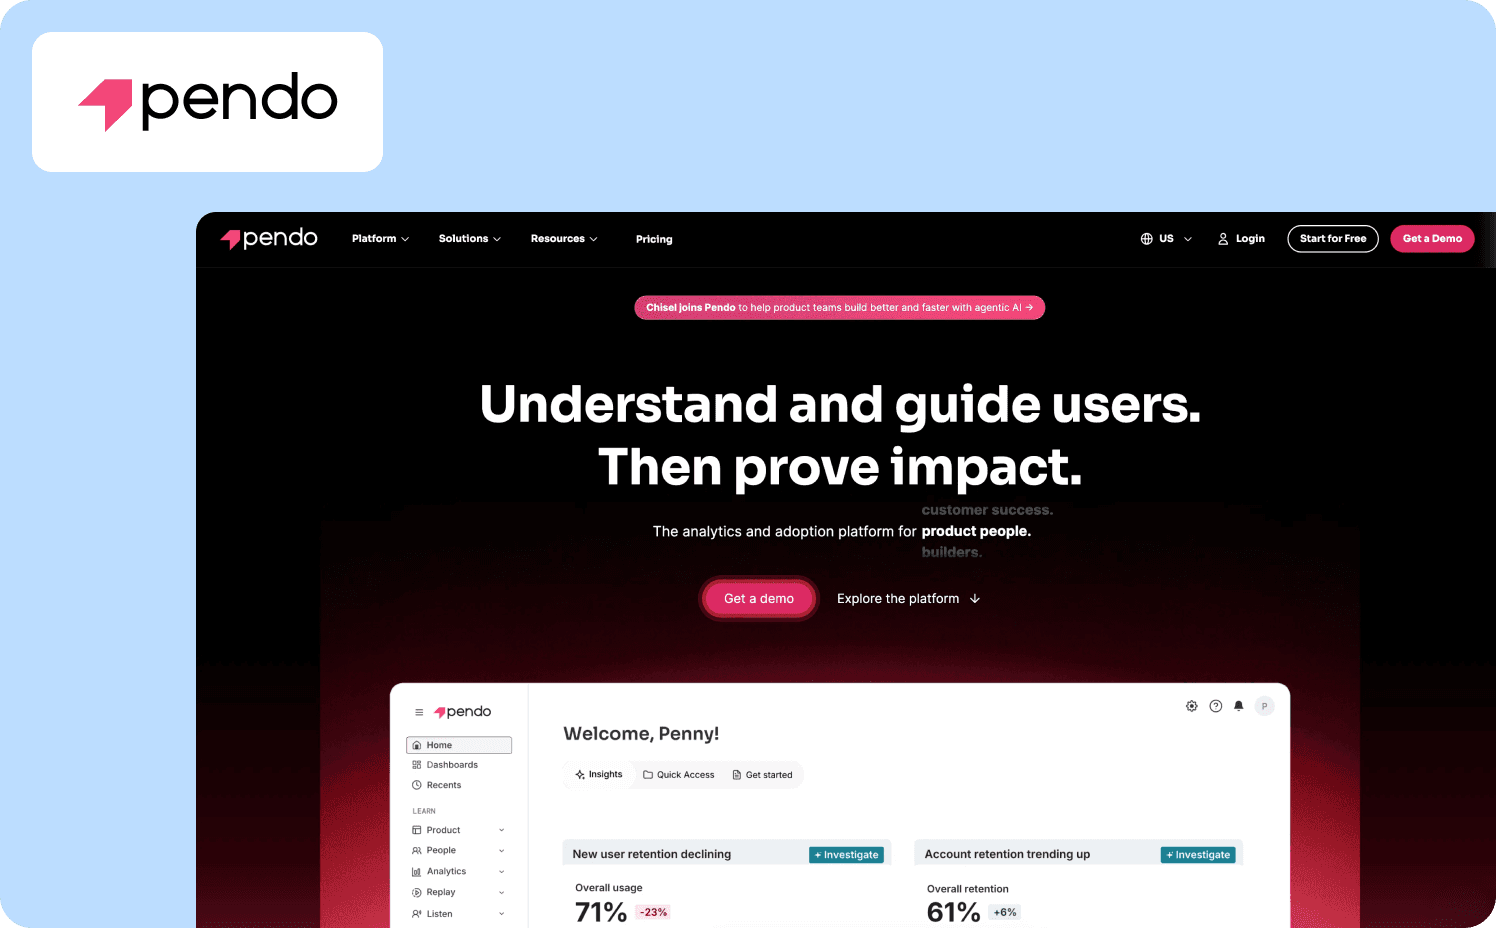
Pendo natively combines product analytics with in-app guidance and feedback collection. It's designed for mid-market to enterprise teams that want to track adoption and respond with contextual tours, tooltips, and walkthroughs all from a single dashboard.
Strengths:
Eliminates tool sprawl: Bundles analytics, in-app guides, session replay, NPS surveys, and feedback in one system.
No-code guide builder: Product managers, customer success, and marketing can create tours, checklists, and tooltips without engineering support.
Retroactive event tracking: Pendo automatically tracks clicks and page views, so you can analyze user behavior without having to manually tag events first.
Limitations: Pendo's pricing is opaque and expensive All paid plans require contacting sales as there's no transparent self-service pricing. The platform has a learning curve for non-technical users and some may find the interface overly complex.
Who it’s for: Enterprise teams with budget who want analytics, guidance, and feedback unified in one platform. Not viable for startups, SMBs, or teams needing transparent pricing and more advanced capabilities.
Pricing:
Free: For 500 MAU
Base: Custom
Core: Custom
Ultimate: Custom
3. Product Fruits — Best for budget-conscious teams needing rapid deployment
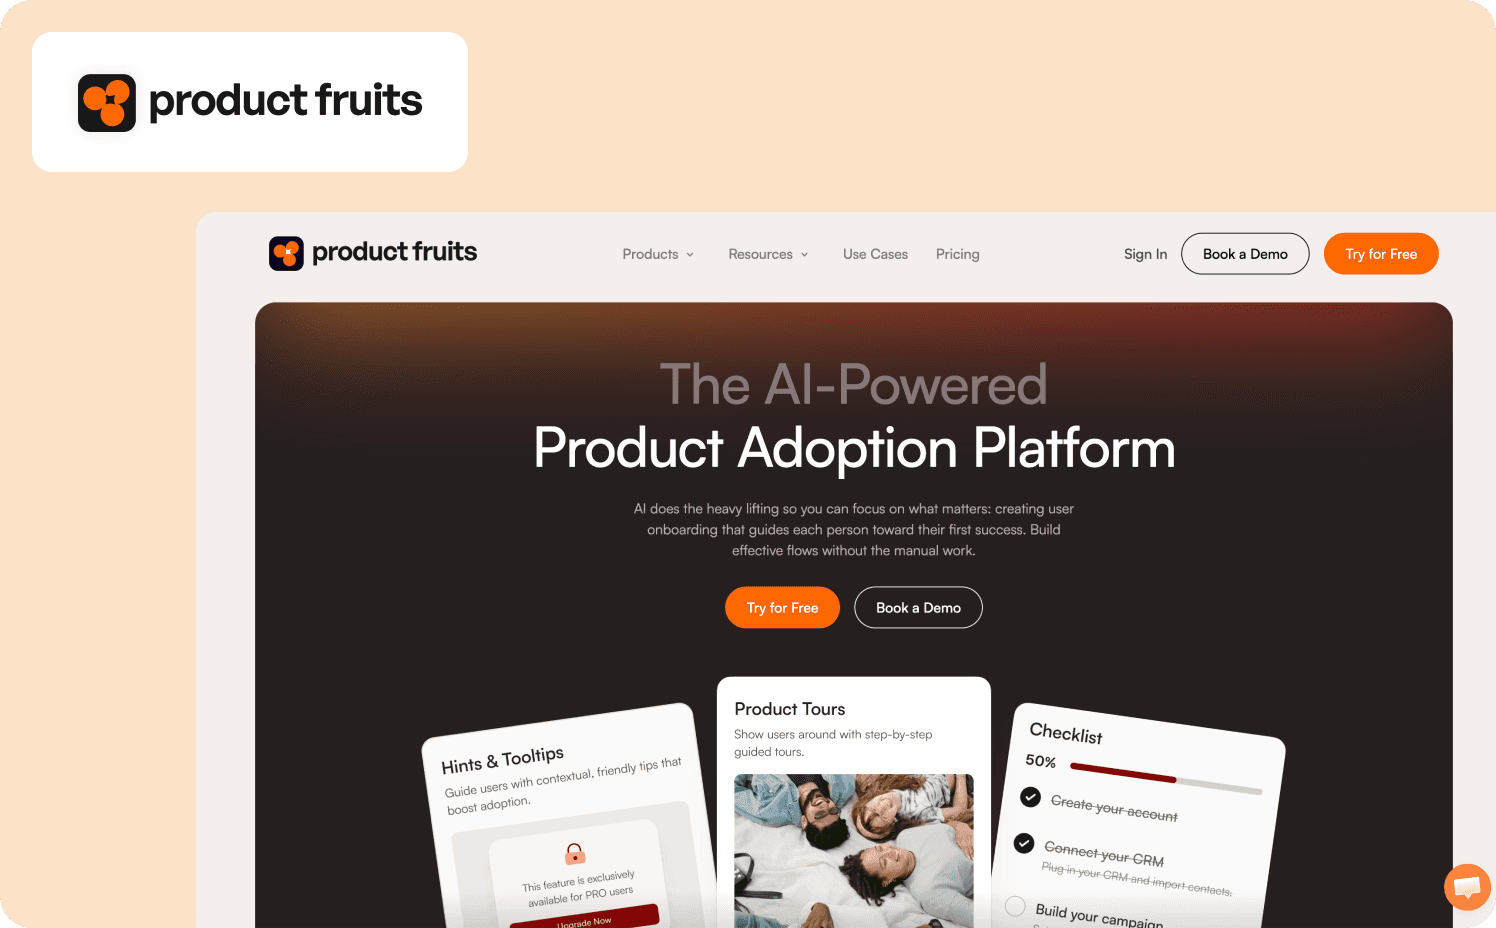
Product Fruits is a no-code product adoption platform that emphasizes speed of deployment and transparent pricing. Analytics capabilities cover basic activation rates and feature adoption tracking with integrations to tools like Google Analytics or Mixpanel for deeper behavioral analysis.
Strengths:
Built-in funnel visualization: Native analytics track custom events, visualize drop-off rates between individual tour cards in funnel format and measure time-to-completion for checklist tasks.
One-to-two week implementation: Rapid deployment with minimal learning curve, letting teams launch onboarding experiences without developer dependency.
Monthly billing option: Unlike most competitors requiring annual contracts, Product Fruits offers month-to-month subscriptions alongside annual plans.
Limitations: Product Fruits analytics are significantly more limited than other platforms on this list. The platform requires integrating external analytics tools to see complete behavioral data.
Best for: Startups and SMBs needing affordable, transparent pricing with quick deployment and already using dedicated analytics tools. Not suited for teams requiring built-in deep product analytics or those needing enterprise-grade complexity.
Pricing:
Starter: $149/mo (1,500 MAUs)
Pro: $249/mo (1,500 MAUs)
Business: $499/mo (1,500 MAUs)
4. Userpilot — Best all-in-one platform combining analytics, guidance, and feedback
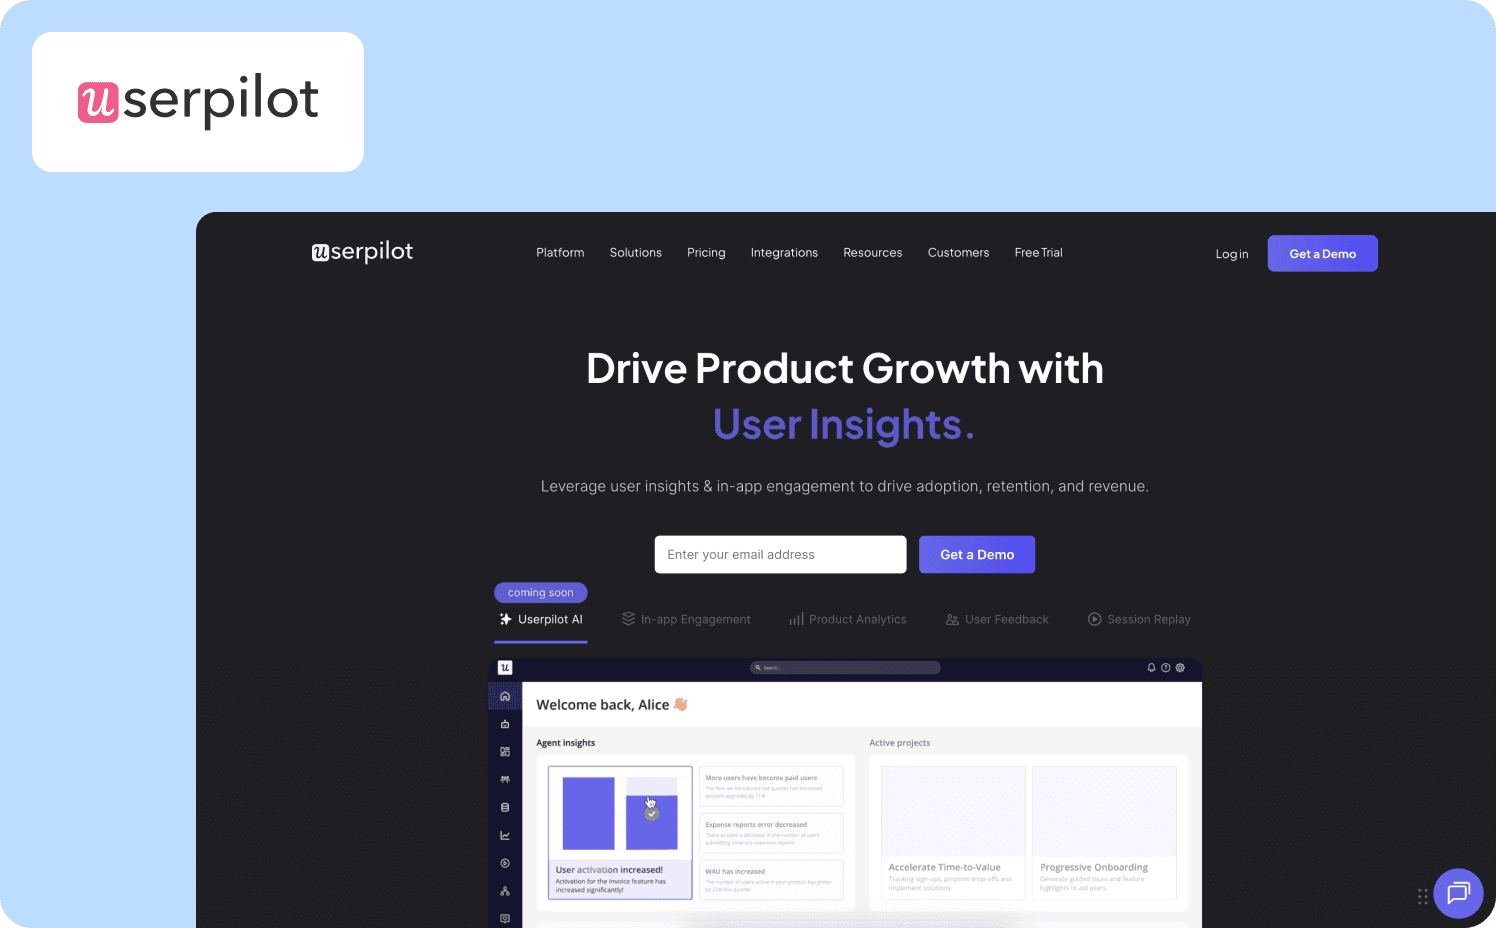
Userpilot is a unified product growth platform that bundles behavioral analytics, no-code in-app guidance, and feedback collection in one system. It's designed for mid-market SaaS teams that want to track adoption metrics and immediately deploy contextual tours and resource centers to improve them.
Strengths:
Complete loop from insight to intervention: Userpilot combines product analytics (funnels, trends, paths, retention, cohorts) with in-app engagement tools in one platform.
Retroactive event auto-capture: Events are captured automatically without code for full historical data.
No-code builder: Product managers, customer success, and marketers can build product tours, spotlights, banners, and checklists.
Limitations: The platform has a learning curve due to its feature depth. Event filtering and custom properties configuration are not always intuitive. Some key features are gated behind higher tiers.
Who it’s for: Mid-market SaaS teams that want analytics and guidance without integrating multiple tools. Not ideal for startups needing transparent self-service pricing or enterprises seeking flexible analytics.
Pricing:
Starter: $299/mo (includes 2,000 MAUs)
Growth: Custom (includes 5,000 MAUs)
Enterprise: Custom (includes 10,000 MAUs)
5. Gainsight PX — Best for customer success teams connecting product usage to account health
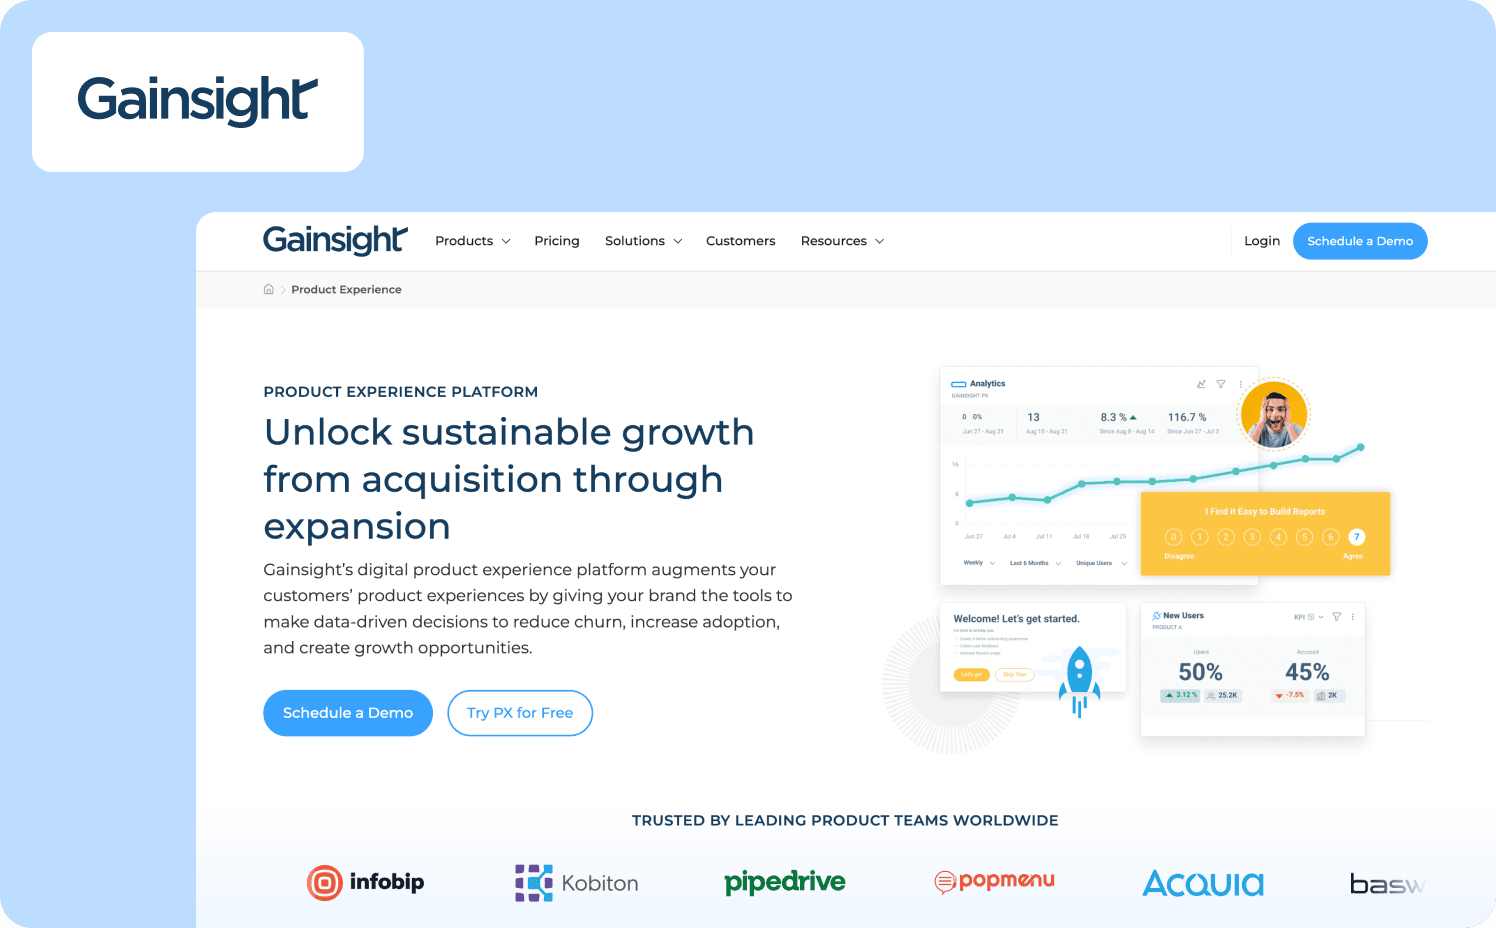
Gainsight PX is a product experience platform that uniquely bridges product analytics with customer success data. It's part of Gainsight's broader customer success ecosystem, designed for mid-market to enterprise SaaS companies that want to connect in-app behavior to customer health scores and lifecycle stages.
Strengths:
Customer success integration: Gainsight PX connects directly to Gainsight CS, letting customer success teams trigger interventions based on product behavior and track how feature adoption impacts health scores and renewal risk.
AI-powered Product Mapper: Product Mapper uses AI to create a hierarchical tree model of your product, associating user events with pages and features automatically.
Template library: Pre-built engagement templates for common use cases let teams launch guides quickly without designing from scratch.
Limitations: The platform is optimized for customer success workflows rather than pure product team needs, making it less suitable for teams without CS infrastructure. Many features require Gainsight CS integration to unlock full value.
Best for: Enterprise SaaS companies with dedicated customer success teams who want product behavior data feeding into CS workflows and health scoring. Not ideal for product-focused teams without CS infrastructure or startups needing transparent pricing and quick deployment.
Pricing:
Grow: $750/mo for 1,000 MAUs
Enterprise: Custom pricing
6. Appcues — Best for non-technical teams needing fast, simple onboarding deployment
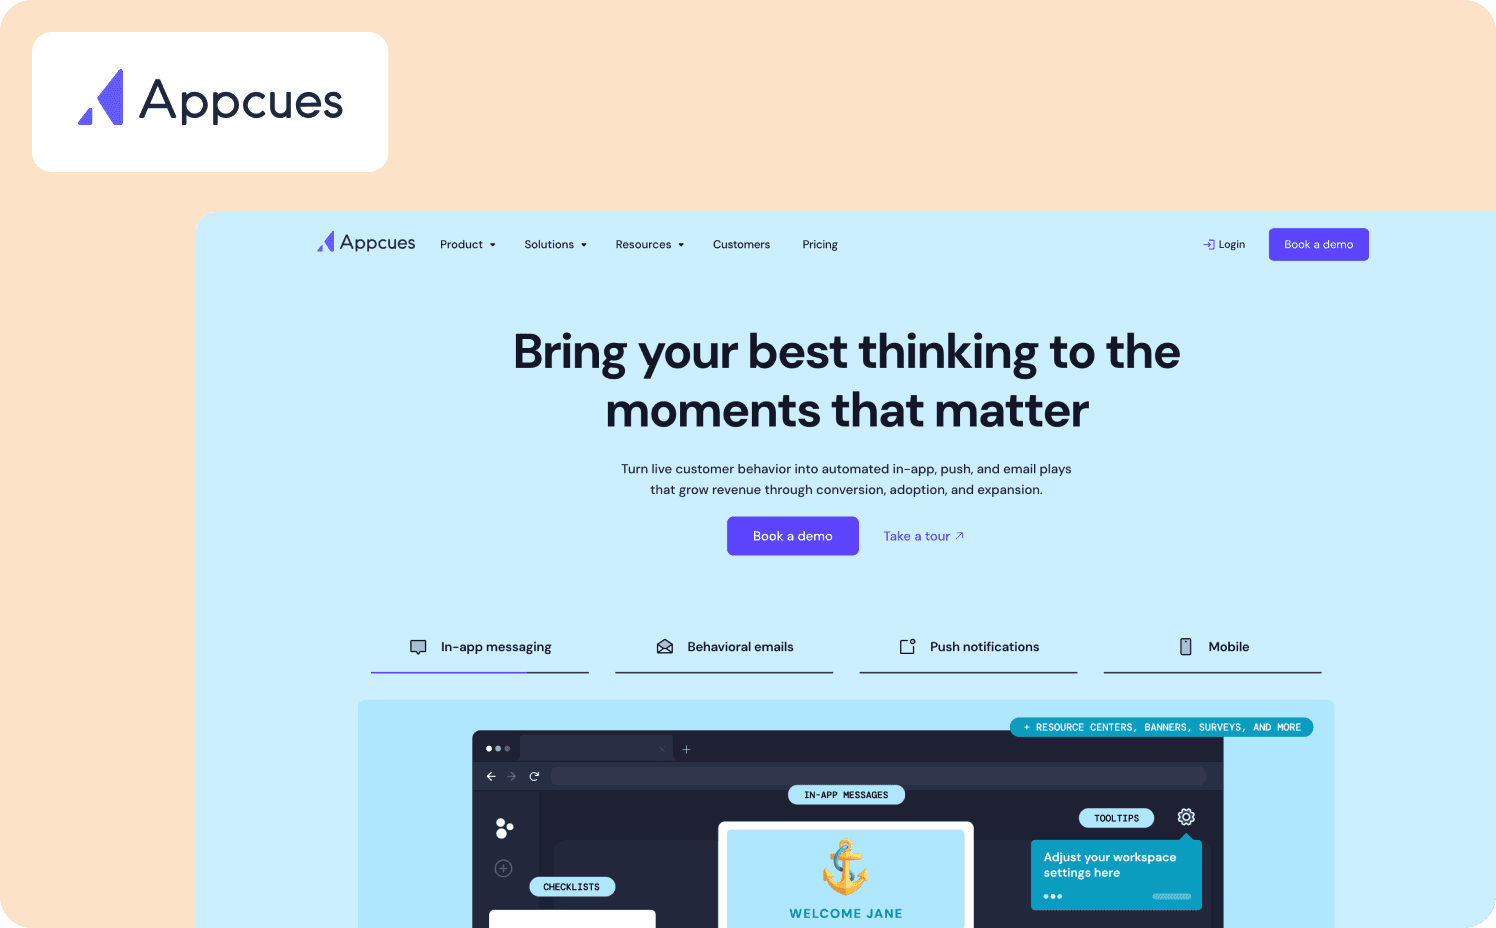
Appcues is a no-code digital adoption platform focused on user onboarding and feature announcement flows. It combines in-app guidance with event tracking, user segmentation, and A/B testing.
Strengths:
Advanced targeting diagnostics: Audience Calculation displays pass/fail results for every targeting condition with the exact property values causing mismatches.
Fast deployment: No-code builder and drag-and-drop interface let teams launch onboarding flows independently without engineering help.
Multi-channel Workflows: Allows teams to build message sequences that re-engage users across channels and direct them to the right tours or follow-ups.
Limitations: Analytics depth is shallower than specialized platforms. Appcues handles basic user segmentation, cohort analysis, and A/B testing but doesn't replace dedicated analytics tools.
Who it’s for: Non-technical teams that need to deploy simple onboarding flows quickly and already have separate analytics tools. Not suited for teams needing deep behavioral analytics or those with tight budgets.
Pricing:
Grow: $750/mo for 1,000 MAUs
Enterprise: Custom pricing
7. Chameleon — Best for design-focused teams prioritizing customization
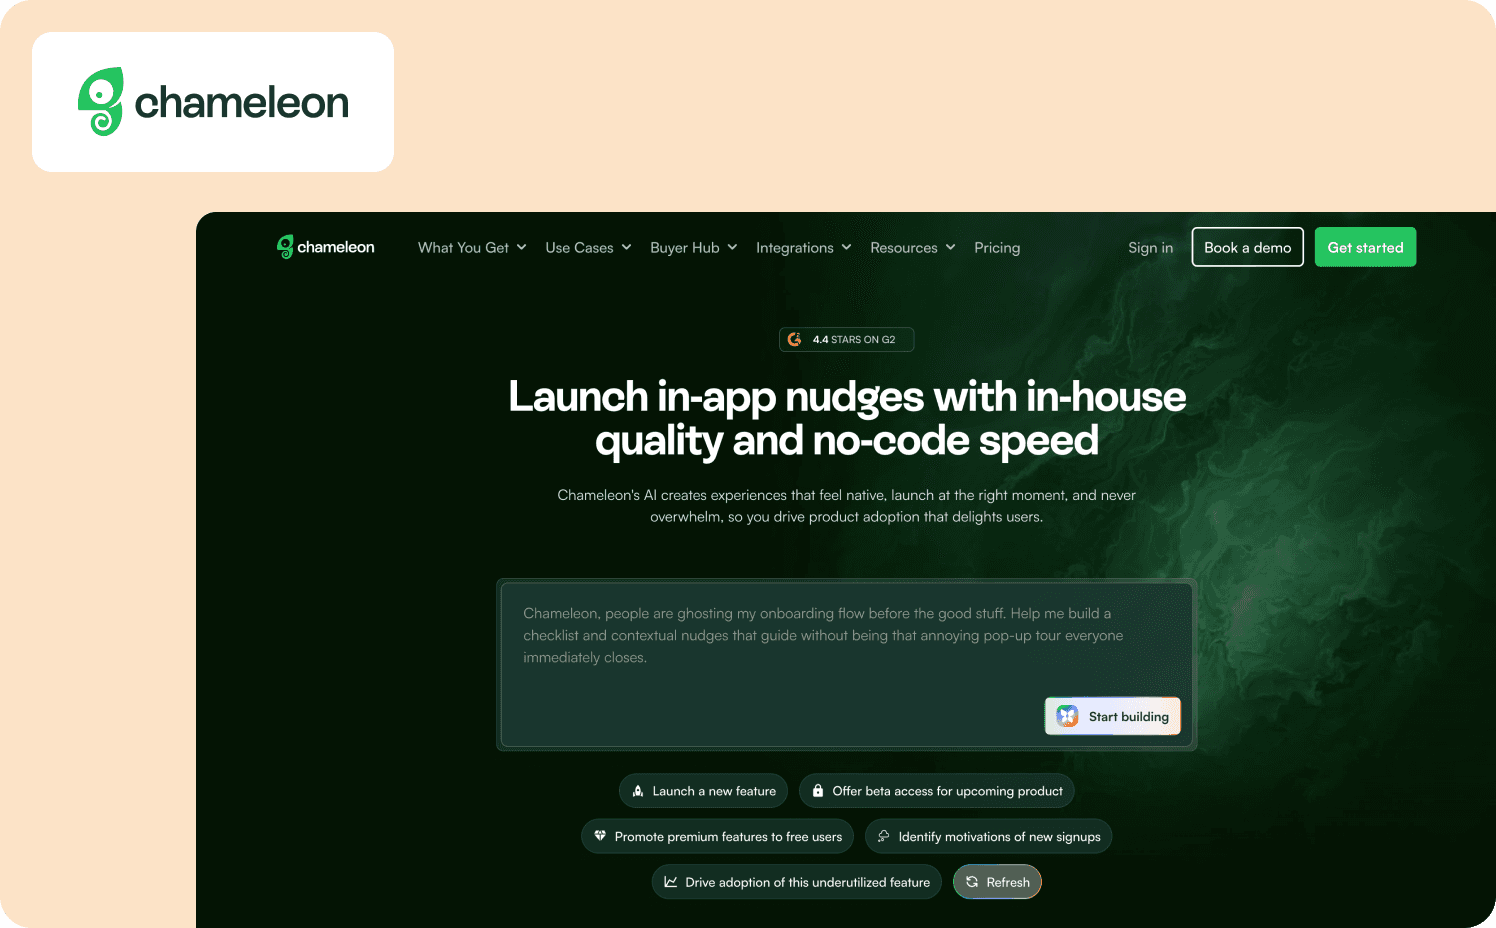
Chameleon is a DAP built for teams that prioritize design flexibility and visual customization in their in-app experiences. Basic analytics track flow completion and goal conversions.
Strengths:
Native paths and funnels visualize user journeys and conversion flows: Built-in analytics create visual journey mapping and funnel analysis showing how users move through your product.
On-brand experiences: Lets you fully control design with custom CSS, embedded cards, and advanced styling options.
Flexible UX patterns: Beyond basic tours, deploy embeddable banners, standalone launchers, CMD+K search interfaces, interactive checklists, and contextual nudges.
Limitations: Chameleon's analytics focus on in-app experience performance rather than comprehensive product analytics. For session replay or autocapture, you need separate analytics tools. CSS knowledge is also needed for advanced customization.
Best for: Design-heavy teams with CSS resources who need perfect brand alignment and already have separate analytics infrastructure. Not suited for non-technical teams or those needing comprehensive built-in product analytics.
Pricing:
Free: Unlimited product-connected interactive demos
Startup: From $279/mo (1,000 MAUs)
Growth: From $15,000/year (1,000 MAUs)
Enterprise: Custom
8. Userflow — Best for web SaaS teams balancing lightweight setup with AI-powered guidance
Userflow is a no-code DAP designed for fast deployment of onboarding flows, checklists, surveys, and in-app guidance elements. Analytics focus on flow completion and engagement metrics, with event streaming to external tools for deeper behavioral analysis.
Strengths:
FlowAI Insights unifies analytics: AI-powered dashboard transforms scattered data into actionable patterns, automatically filtering by product, content, or time period.
Rapid setup: Lightweight architecture and intuitive drag-and-drop builder let teams launch flows the same day.
AI-powered content tools: FlowAI automatically generates editable onboarding flows from prompts, rephrases content for clarity, and translates experiences across languages—cutting content creation time dramatically.
Limitations: Userflow has native analytics, but lacks advanced product analytics like funnels, user paths, and retention cohorts. It requires integrations for deeper behavioral analysis and does not support mobile.
Best for: Web-based SaaS startups and mid-market teams wanting fast onboarding deployment with AI assistance and already using separate analytics tools. Not suited for mobile-first products or teams needing native funnel/retention analytics without integrations.
Pricing:
Startup: From $240/mo (3,000 MAUs)
Pro: From $680/mo (10,000 MAUs).
Enterprise: Custom
9. Whatfix — Best for enterprises requiring deep customization and professional services
Whatfix is an AI-powered enterprise digital adoption platform designed for organizations deploying guidance across complex software ecosystems. The three-product suite includes a DAP, Product Analytics, and Mirror for event tracking, funnel analysis and interactive walkthroughs.
Strengths:
Actionable insights recommend interventions: Whatfix integrates AI-driven pattern detection directly into its analytics dashboard, automatically identifying workflow problems, disengagement trends, and training gaps.
AI-powered content: AI tools generate walkthroughs automatically from recorded workflows.
Mirror enables risk-free training: Whatfix Mirror replicates production applications for hands-on training without touching live data
Limitations: Whatfix requires significant investment, both time and money. Pricing complexity requires separate quotes for each product (DAP, Analytics, Mirror) and charges vary by application count and user type.
Best for: Large enterprises (500+ employees) with complex software stacks, budget for six-figure deployments, and technical setup for implementation. Not viable for mid-market SaaS companies or organizations needing rapid self-service deployment.
Pricing:
Standard: Custom
Premium: Custom
Enterprise: Custom
10. WalkMe — Best for large enterprises needing cross-application workflow automation
WalkMe is a DAP designed for enterprises managing complex software ecosystems spanning multiple applications. As a pioneer in the in-app guidance category, it delivers Smart Walk-Thrus, contextual SmartTips, workflow automation via ActionBot, and UI Intelligence analytics that surface issues across desktop, web, and mobile environments. Product analytics capabilities are available as premium add-ons priced separately from the base platform.
Strengths:
Flow Analytics: Allows enterprises to analyze and optimize business processes that span different software systems.
Cross-application guidance: Unifies onboarding and support flows across disparate systems, letting large organizations standardize workflows and automate repetitive tasks without rebuilding each application.
Advanced workflow automation: ActionBot automates multi-step processes, pre-fills forms, and triggers actions based on user context.
Limitations: WalkMe's pricing is expensive for mid-market and small businesses. The platform also has a steep learning curve and maintenance burden that can discourage users.
“I spent so much time building tours with WalkMe that at some point you just get discouraged. You don't update them anymore, which is not a good thing.”
Best for: Large enterprises with multiple internal applications, dedicated budgets for digital transformation, and resources for long implementation cycles. Not viable for startups, SMBs, or teams needing rapid deployment and transparent pricing.
Pricing:
WalkMe for employees: Custom
WalkMe for customer: Custom
11. Mixpanel — Best for product-led growth teams focused on funnel optimization
Mixpanel is an event-based analytics platform built for understanding conversion paths and retention patterns. It excels at funnel analysis and cohort tracking, making it popular with product-led growth teams that prioritize activation metrics.
Strengths:
Real-time funnel analysis: Mixpanel's real-time analytics funnel builder visualizes multi-step conversion paths and pinpoints friction points in minutes.
Free tier includes 1M monthly events: The free plan covers most early-stage products with unlimited saved reports and cohorts, plus 10K session replays.
Impact Report predicts which actions drive retention: Automatically identifies which user behaviors correlate with long-term retention, showing which features to prioritize for driving adoption and reducing churn.
Limitations: Mixpanel is analytics-only. It shows you the problem but doesn't help you fix it. To close the loop from insight to intervention, you'll need to integrate a separate DAP and manually sync cohorts for targeting. Setup requires technical resources as instrumentation is code-heavy and assumes developer involvement for event tagging.
Who it’s for: Product-led growth teams that already have engineering support and want deep funnel and retention analytics. Not suited for teams that want actionable insights in one tool or those without technical help for implementation.
Pricing:
Free: Capped at 1M monthly events
Growth: Starts at $140/mo
Enterprise: Custom
12. Amplitude — Best for teams that need deep behavioral analytics
Amplitude is a behavioral analytics platform built for product teams that want to understand how users progress through adoption milestones. It tracks event sequences, cohorts users by behavior patterns, and surfaces which actions predict retention.
Strengths:
Behavioral cohorting: Cohorts users based on the specific features they use and in what order to show you which adoption paths lead to retention.
Session replay: Amplitude bundles session replay with analytics allowing you to watch exactly where users stall.
Best-in-class retention analysis: Retention charts and behavioral cohorts show exactly which action sequences correlate with users who stay past Day 30, Day 90, and beyond.
Limitations: As an advanced analytics-only platform, Amplitude doesn’t provide guidance on how to address any problems. The platform also requires technical setup. You'll need developer time to instrument the SDK before PMs can build guides or run analyses.
Who it’s for: Product-led growth teams that already have engineering support and want the deepest behavioral analytics available. Not suited for teams that need to act on insights without integrating multiple tools or those without technical resources for SDK implementation.
Pricing:
Starter: Free up to 10M events
Plus: $61/mo up to 25M events
Growth: Custom
Enterprise: Custom
13. PostHog — Best for developers who want open-source analytics with self-hosting
PostHog is an open-source product analytics tool that bundles session replay, feature flags, A/B testing, and surveys in one developer-friendly tool. It offers a great free tier and a self-hosting option for teams with strict data privacy requirements.
Strengths:
Open-source with self-hosting: MIT-licensed code can be deployed on your infrastructure, eliminating vendor lock-in.
Group analytics tracks adoption at account level: Analyzes feature adoption by company, team, or organization.
Feature flags and experiments bundled with analytics: Includes feature flags for controlled rollouts and A/B testing for measuring impact.
Limitations: PostHog lacks in-app guidance. Surveys are basic, product tours are in early alpha, and there are no production-ready tooltips or walkthroughs. Setup also requires developer involvement. PostHog is built for technical teams comfortable with SDKs and data infrastructure.
Who it’s for: Teams that prioritize analytics, feature flags, handling sensitive customer data internally, and data ownership over onboarding tooling. Not suited for non-technical product teams or those needing a complete adoption platform without integration capabilities.
Pricing:
Free
Pay-as-you-go: Starts at $0.00005 per event
Add-ons: Enterprise add-on $2,000/mo, Scale add-on $750/mo, Boost add-on $250/mo
14. Heap — Best for teams wanting automatic tracking without manual event instrumentation
Heap is an autocapture analytics platform that automatically records every click, tap, swipe, pageview, and form submission with no manual event tagging required. You can define events retroactively and analyze historical behavior without missing data.
Strengths:
Autocapture: Install one snippet and Heap captures all interactions automatically.
AI-powered alerts: Heap's AI CoPilot monitors feature adoption trends and sends automatic alerts when usage declines week-over-week or drops below thresholds you set,
Built-in session replay and heatmaps: Watch actual user sessions and see heatmaps of on-page behavior without integrating separate tools.
Limitations: Heap has zero native in-app guidance capabilities since it's an analytics-only platform. Pricing isn’t transparent and data maintenance becomes increasingly difficult as event volume grows.
Who it’s for: Teams with limited engineering resources who want comprehensive behavioral data without manual instrumentation. Not suited for teams needing to act on insights without integrating multiple tools or those requiring transparent pricing.
Pricing:
Free: Up to 10k monthly user sessions
Growth: Custom
Pro: Custom
Premier: Custom
Why Jimo leads this list
Jimo isn't the deepest analytics tool on this list. It wins because it's the only platform built specifically to eliminate the weeks-long gap between detecting adoption friction and shipping the fix. The gap that slows activation and expansion.
It solves the activation bottleneck, not just the tracking problem
When your onboarding funnel shows a 40% drop-off at step three, Amplitude surfaces the drop-off. Jimo is designed to act on it immediately. No sprint planning or engineering dependency required. Zenchef cut onboarding time by 50% while maintaining activation outcomes. AB Tasty compressed user onboarding from three months to two weeks — a six times improvement only possible when product teams control both the data and the fix.
Activation isn't an analytics problem. It's an execution speed problem. Jimo solves execution.
It proves roadmap ROI, not just deploys tours
Most digital adoption platforms let you build onboarding tours. They don’t connect those tours to revenue outcomes, which means PMs still can't prove which features drive retention.
Jimo tracks how users interact with guidance elements and adoption behaviors, letting teams connect engagement patterns to activation and retention trends. This closes the loop between product investment and outcomes. Drivepoint used this to eliminate dev dependency for customer success operations. “Jimo didn't just change our toolset; it changed my mindset,” Franziska Ibscher, Product Manager at Drivepoint, says. “Now, my first thought is always, ‘How can Jimo help with this?’ before even considering involving engineers. It's empowering!”
When PLG teams can tie adoption milestones to expansion outcomes, leadership stops seeing product-led as a cost center.
Deflecting support tickets, not just documenting friction
Linear tours assume users follow a fixed path. Support tickets prove they don't. Jimo's action-based logic responds to what users actually do, delivering contextual help exactly where they get stuck.
EMAsphere cut support tickets to near-zero for platform maintenance, not by writing better docs, but by deploying guidance at the moment of a drop-off. Recollective reached 20x more users than email-based communication ever did. Trigify reduced churn by 23% through the same targeted interventions.
Tours that rely on passive clicks don’t change behavior. Action-based guidance that requires completion does.
Is Jimo the right product analytics tool for you?
Jimo isn't designed for data science teams building custom retention models or enterprises orchestrating guidance across 10+ legacy applications. If you need six-figure budgets, six-month implementations, or behavioral analytics depth matching Mixpanel's cohort engine, there are better fits on this list.
Jimo is built for growing B2B SaaS teams running a product-led or hybrid motion — especially those with self-serve onboarding and dedicated product or customer success ownership. If you already track product usage in tools like Mixpanel, Amplitude, or Segment but still rely on engineering to ship onboarding improvements, Jimo closes that gap.
If activation impacts expansion revenue in your business, and sprint dependency is slowing your response time, Jimo is worth a closer look. See how Jimo connects your analytics to in-app action.
FAQs
Are there free product analytics tools for adoption tracking?
Yes, several product analytics tools offer free tiers: Mixpanel provides 1M monthly events with 10K session replays, Amplitude supports 50K monthly users with session replay, and PostHog includes 1M events plus 5K replays (or unlimited via self-hosting). Google Analytics is free but better suited for web analytics and marketing analytics than deep product analytics.
How does Amplitude compare to Jimo for adoption tracking?
Amplitude and Jimo are complementary. Amplitude excels with predictive insights and retention analysis, making it the best product analytics tool for data scientists needing advanced analytics across web and mobile apps. Jimo integrates with Amplitude (and Mixpanel, Segment, PostHog) to turn those insights into in-app guidance without engineering work.
What's the difference between product analytics and adoption tracking?
Product analytics measures how users interact with your product — everything from page views to feature usage across user journeys. Adoption tracking is a specific subset focused on progression through value milestones and conversion to retained users, revealing which behaviors predict customer retention rather than just surface-level user interactions.
Can I track feature adoption without a developer?
Yes, modern product analytics tools support no-code feature adoption tracking. Jimo's Success Tracker lets product managers point at UI elements to tag them, Pendo offers retroactive automatic data capture, and Heap's autocapture records all detailed user interactions from day one without manual event tagging.
What metrics should I track for feature adoption?
The best product analytics tools track a few core metrics: activation rate (users reaching first value), feature usage frequency, time to value, retention by cohort (which user segments stay active), and feature stickiness (DAU/MAU ratio). Analytics software like Mixpanel excel at retention analysis, while tools like Jimo combine funnel analysis with in-app intervention.
What's the difference between onboarding analytics and adoption tracking?
Onboarding analytics focuses on first-time user experience during the initial 1-7 days, measuring activation flow completion and time-to-first-value. Adoption tracking extends far beyond to measure ongoing feature usage, user engagement over time, and conversion from casual users to power users.
Which product analytics tools provide both tracking and in-app intervention?
Jimo leads with Success Tracker analytics plus contextual tours and AI-powered guidance letting product teams track user behavior and deploy fixes the same day. Userpilot bundles analytics with no-code tours and tooltips, while Pendo unifies product analytics and in-app guides at enterprise pricing.
Can Google Analytics replace product analytics software?
No, Google Analytics is designed for web analytics and to optimize marketing strategies — tracking traffic sources, page views, and conversion funnels — but lacks the depth needed for product analytics. It can't measure feature usage patterns, customer behavior within your application, or progression through multi-step adoption milestones without extensive custom configuration. For product teams needing to track user interactions, custom event tracking, and retention analysis, dedicated product analytics tools like Jimo, Amplitude, or Mixpanel provide the analytics and data analysis capabilities Google Analytics wasn't built to handle.