TL;DR
This article is for Heads of Product and VPs of Product at B2B SaaS companies who have solved their onboarding problem and are now facing a harder one: flat adoption curves, shallow feature usage, and expansion revenue that is not materializing despite healthy activation metrics. It argues that B2B product adoption requires a stage-specific approach across four distinct lifecycle phases: Feature Discovery, Depth Adoption, Team-Level Adoption, and Sustained Adoption. And each has its own failure mode and its own strategy. The article also covers why B2B adoption is structurally different from consumer or PLG adoption (multi-user accounts, expanding product surfaces, role-based feature relevance), applies Jimo's Intelligence-Led Growth framework to each stage, and shows how behavioral automation turns a strategy that would otherwise require a CS team per account into something a single product team can operate at scale. Crossbeam's 3x click-through rate improvement from switching to behavioral routing over role-based announcements anchors the Feature Discovery stage. A five-question diagnostic at the end tells you which stage to address first given where your adoption curve is currently breaking.
Your onboarding program is working. Users activate. They complete setup, reach their first value moment, and your activation rate reflects that. And yet, three months later, the same cohort of users is using two or three features, ignoring the rest of the product, and showing up in your churn risk reports.
This is an adoption problem, and fixing the onboarding flow will not solve it.
Most B2B product teams conflate activation with adoption. They are not the same thing. Activation is the moment a user first gets value from the product. Adoption is the ongoing process of users expanding how deeply and broadly they engage with the product: across features, across sessions, and in B2B contexts, across an entire team within an account. The strategies that drive first-session activation do not drive sixth-week feature adoption. The teams that understand that distinction and build a practice around it are the ones widening the gap on retention and expansion revenue.
This article covers the best practices for driving product adoption in B2B software across four distinct stages of the user lifecycle, how to measure each stage accurately, how automation scales what would otherwise be a manual CS operation, and how to diagnose which stage your specific adoption curve is breaking down at.
Why B2B Product Adoption Requires a Different Strategy Than Onboarding
In a consumer SaaS product, adoption is largely an individual problem: one user, one activation path, one retention curve. PLG thinking was built for that context. Get the product to sell itself, instrument the funnel, optimize the activation event, and the math works.
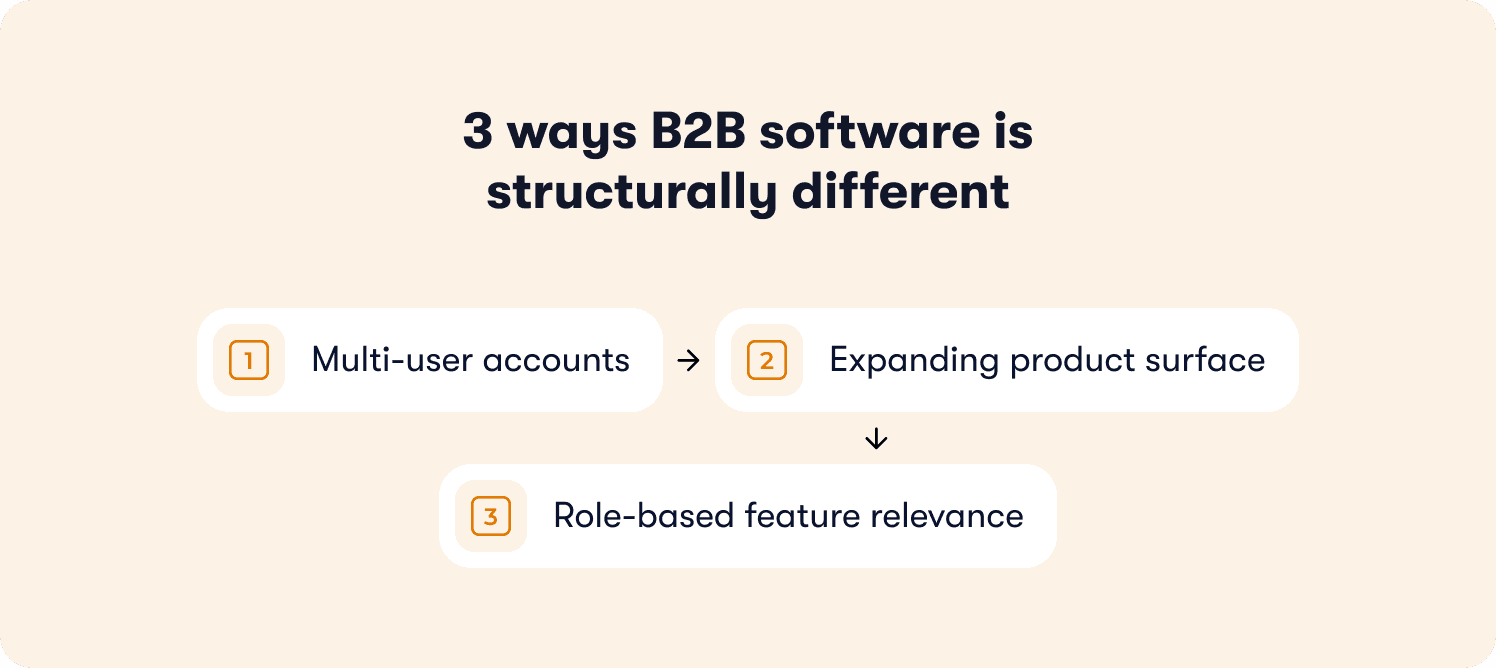
B2B software is structurally different in three ways that consumer-oriented adoption thinking does not address:
Multi-user accounts. The champion activates. The rest of the team does not. Individual activation data looks healthy while account-level feature penetration is a fraction of what it could be. A PM reviewing session data sees active users. The CSM reviewing the renewal conversation sees a product embedded in one person's workflow and nowhere else in the organization.
Expanding product surface. Features added post-signup require re-adoption from existing users, not just first-time onboarding for new ones. A user who fully adopted the product in January has not adopted the three capabilities shipped since then. Their adoption curve has effectively reset at each release without anyone designing for that reset.
Role-based feature relevance. In a B2B product, the features that drive retention for an account administrator are different from the ones that drive retention for an end user in the same account. A single onboarding flow or adoption campaign designed for the average user serves neither well.
These three dynamics are why B2B product adoption requires a stage-specific practice, not a one-time optimization. PLG taught us that the product should sell itself. ILG extends that premise: your product doesn't just sell itself — it activates itself, at every stage of the user lifecycle, for every user in every account.
For the foundational tactics on moving users from first login to initial activation, Jimo's guide to increasing product adoption covers that earlier stage. This article picks up where activation ends.
The Four Stages of B2B Product Adoption
Adoption is not a single event and it is not a single metric. It moves through four stages after activation, each with a distinct failure mode and a distinct strategy. Teams that treat all four as the same problem will apply the wrong solution to at least three of them.
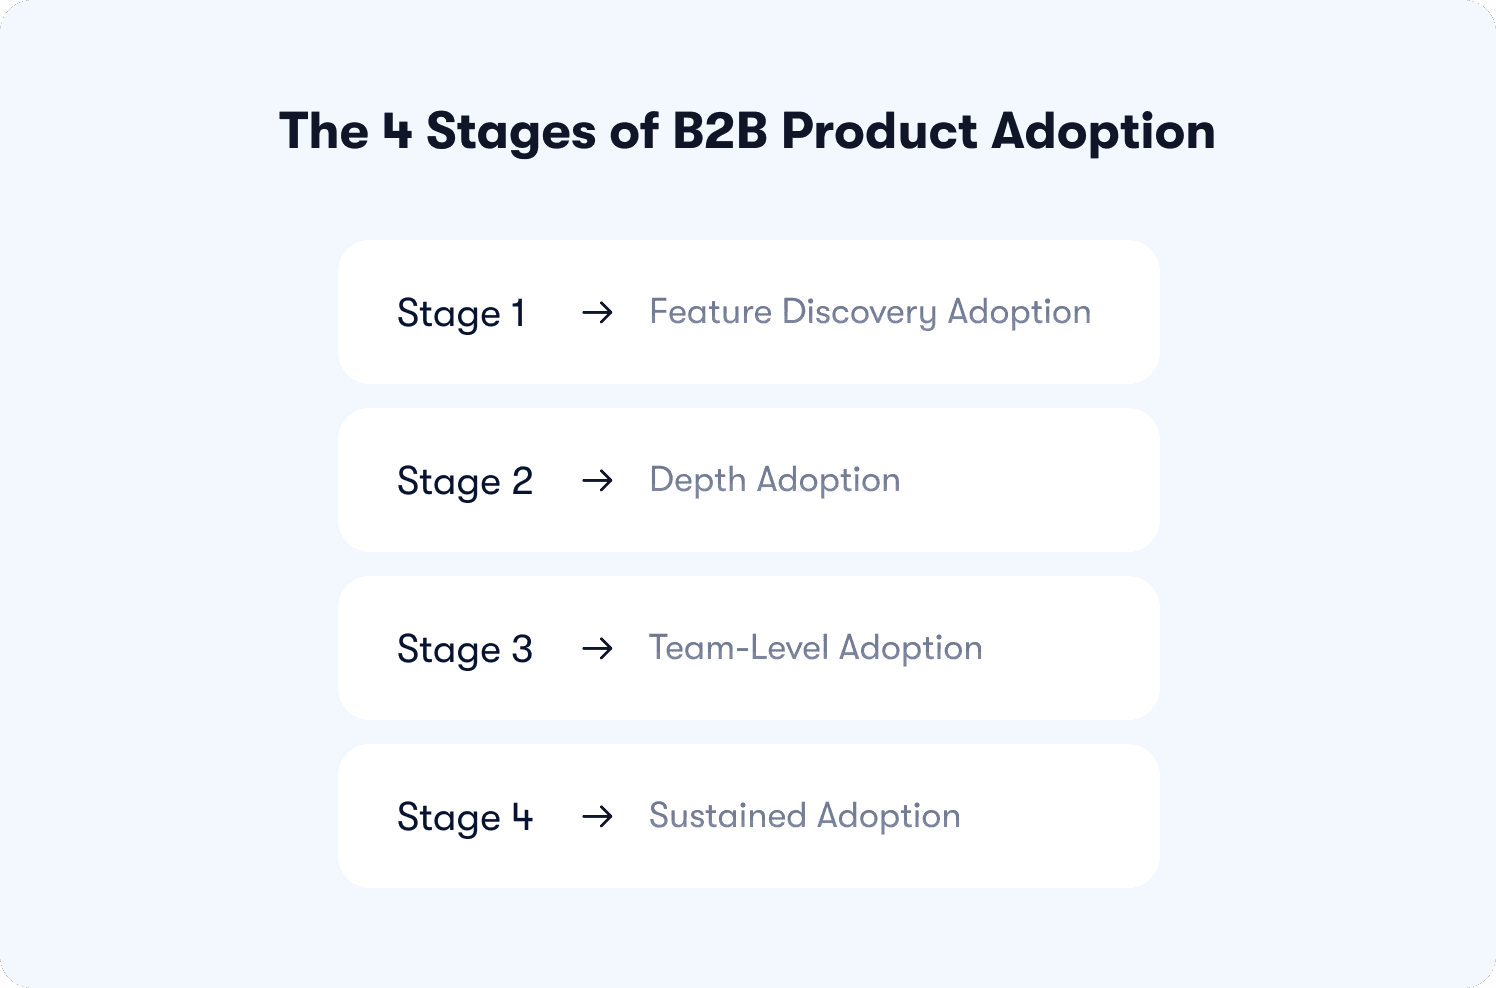
Stage 1: Feature Discovery Adoption
The problem: Users are active but using a narrow slice of the product. Secondary features exist — your team shipped them, documented them, announced them at launch — and your active users have not touched them. Feature adoption breadth is low despite strong session counts.
What breaks without a strategy: Product teams ship new capabilities into a vacuum. Power users find them by accident or through documentation. Most users do not find them at all. The product's value surface expands while the average user's engagement with it stays flat.
The strategy:
Behavioral announcement routing. Surface feature announcements to users whose behavior signals they are ready for the next capability — not to all active users on the launch date, and not to users already using the feature daily. A user who has been using core workflow X consistently for three weeks is the right audience for the announcement of the feature that extends workflow X. A user who signed up yesterday is not.
Contextual discovery guidance. When a user's in-session behavior indicates proximity to an unadopted feature — navigating near it, completing the prerequisite action, or hitting a workflow ceiling — surface a hint or short tour at that moment rather than waiting for the user to discover the feature independently.
Crossbeam implemented this behavioral routing approach for their in-product banners and saw a 3x click-through rate over their previous role-based announcement strategy. The difference was not the content of the announcement. It was the timing relative to user behavior. Their full story is in Jimo's customer stories.
Jimo's announcement product and feature walkthroughs are the execution layer for this stage. The analytics segments tool provides the behavioral signal that determines who receives which announcement and when.
Stage 2: Depth Adoption
The problem: Users have discovered secondary features but use them inconsistently. The behavior exists but has not become a habit. Usage is episodic rather than embedded in the user's workflow. Feature retention at 60 days is significantly below feature retention at 7 days.
What breaks without a strategy: Engagement metrics look healthy in aggregate but mask the fragility of individual feature adoption. A user whose engagement with a key feature is intermittent is one workflow change or one competitor demo away from abandoning it entirely. That fragility does not appear in session data. It appears in churn data six weeks later.
The strategy:
Action-gated milestone tracking. Track behavioral milestones beyond initial setup — not "did the user click on this feature" but "did the user complete the action that demonstrates they have incorporated this feature into their workflow." Checklists tied to feature-depth behaviors, not feature-discovery clicks, give both the user and the product team an accurate picture of real adoption progress.
Progress visibility for the user. Users who can see their own adoption progress re-engage with the product at higher rates than users who cannot. Making milestone completion visible inside the product creates a self-reinforcing engagement loop that does not require CS outreach to sustain.
Behavioral re-engagement nudges. When usage of a key feature drops below a defined threshold, the product acts — not the CS team. A hint surfaced at the moment a user returns to a feature they have been ignoring for two weeks is categorically more effective than a Day-30 email campaign designed before the drop was detected. This is the Execute mode of Jimo's Autonomy Matrix in practice: the product identifies the adoption gap and responds to it without waiting for a human to notice.
Stage 3: Team-Level Adoption
The problem: This is the B2B-specific failure mode. The champion is fully adopted. Their team is not. Account-level feature penetration is a fraction of what individual champion metrics suggest. Expansion revenue conversations with CS stall because the product is embedded in one workflow, belonging to one person, and the account-level business case for expansion does not exist yet.
What breaks without a strategy: Sales and CS see expansion potential in the account. The product team sees healthy individual user metrics. The account churns at renewal because the product was never embedded across the team — it was used by one person who has since changed roles, taken parental leave, or left the company. Single-champion accounts are the highest-risk segment in a B2B SaaS retention portfolio, and most product teams have no visibility into which accounts they are.
The strategy:
Role-specific onboarding for secondary users. When a new seat is added to an account, the secondary user should receive a flow designed for their role within the account — not a repeat of the champion's onboarding path. An end user joining a workspace their admin has already configured needs a different experience than the admin who set it up. Jimo's segmented responses and personalized onboarding flows handle this routing without engineering involvement.
Account-level adoption reporting. Surface team-level adoption gaps before they become churn signals. Which features is the champion using that no other seat in the account has touched? Which users in the account have not logged in this month? This data exists in your behavioral stack — the gap is surfacing it in a form that lets a product team act on it. Jimo's actionable reports and analytics segments make account-level adoption gaps visible at the cohort level.
Internal advocacy enablement. The champion who can share a workflow demonstration or a personal value moment with their team from inside the product is more effective than any outbound campaign a marketing team can run. Designing for that internal sharing moment is a product decision, not a CS decision.
Stage 4: Sustained Adoption
The problem: Users who have been fully adopted are at risk of feature abandonment when the product evolves, their workflow changes, or a competing tool enters their stack. Most product teams manage sustained adoption reactively — through churn interviews and win-loss analysis — rather than proactively through behavioral signals that surface at-risk users before they disengage.
What breaks without a strategy: The product ships an improvement to a feature that active users relied on. Those users encounter a changed experience, receive no guidance, interpret the change as a product regression, and quietly reduce usage. The support ticket volume spikes for two weeks post-release. The behavioral drop-off that precedes churn begins. By the time NPS reflects the damage, the renewal conversation is already at risk.
The strategy:
Encounter-triggered re-onboarding for changed features. When a user navigates to a feature that has changed since their last session, a hint surfaces at that exact moment and explains what changed and where the equivalent functionality now lives. This is not a launch email. It is guidance delivered to each user at the specific moment their prior knowledge of the product is now incorrect.
Usage health scoring. Build a behavioral model of what healthy adoption looks like for each feature — frequency, depth, sequence — and flag accounts whose score is trending down before the drop crosses a churn-risk threshold. Jimo's retention insights and growth tools surface these trends at the user and account level.
Proactive in-product re-engagement. When a health score drops below a threshold, the product communicates. Not a Day-45 re-engagement email from a sequence built before the user's behavior changed, but an in-product announcement triggered by the specific behavioral pattern that signals disengagement. The product that continuously activates users into new workflows and re-engages them at the first signal of drift does not accumulate the feature abandonment churn that eventually shows up in retention cohorts.
Jimo's hints, announcement product, and retention insights are the execution layer for this stage.
📖 B2B Activation Playbook: The stage framework above tells you what to build. Jimo's B2B Activation Playbook gives you the step-by-step tactics for executing each stage — from the first behavioral trigger to account-level expansion plays. If you are building or auditing your adoption practice, start here before configuring any flows.
How to Measure Product Adoption at Each Stage
Onboarding measurement tracks activation. Product adoption measurement tracks what happens after. These require different metrics, and conflating them produces adoption reports that look healthy while the retention curve quietly deteriorates.
The activation event and its measurement framework are covered in Jimo's onboarding success metrics guide. The four metrics below begin where that guide ends.
Stage | Primary metric | Secondary signal | What it tells you |
Feature Discovery | Feature activation rate by cohort | Time-to-second-feature adoption | What percentage of active users have touched each secondary feature at least once, and how long it takes from first activation |
Depth Adoption | Feature retention rate at 30/60/90 days | Usage frequency per feature | Whether discovered features become consistent habits or spike-and-drop after discovery |
Team-Level Adoption | Account feature penetration rate | Seat activation ratio | How many seats in an account are actively using each key feature vs. how many have access to it |
Sustained Adoption | Usage health score trend | Feature abandonment rate | Whether adoption is stable, growing, or deteriorating for tenured users — and which features are losing ground |
Two observations on using this table in practice. First, most product analytics stacks surface the Feature Discovery and Depth metrics naturally. The Team-Level and Sustained metrics require account-level aggregation that many teams have not yet built. Jimo's actionable reports and behavior metrics tools handle that aggregation without requiring a data engineering sprint. Second, the right cadence for reviewing these metrics differs by stage: Feature Discovery metrics are meaningful weekly, Depth metrics monthly, Team-Level metrics at the account health review cadence, and Sustained metrics as part of the renewal pipeline review.
Automation in Scaling B2B Product Adoption
The four-stage framework above describes strategies that, if executed manually, would require a CS team member per account. That is not a product adoption strategy. It is a managed services model. The practice only scales if behavioral automation carries the operational load.
The distinction that determines whether automation feels intelligent or robotic to the user is not complexity. It is timing. Automation triggered by calendar time feels like a system: the user who receives a "we noticed you haven't tried Feature X" email on Day 30 of their subscription, regardless of whether they have used Feature X daily for three weeks or have never logged back in since day one, knows they are in a sequence. Automation triggered by what the user actually did feels attentive: the announcement that surfaces when the user's behavior signals readiness for the next capability reads as the product paying attention to them specifically.
Three principles govern effective adoption automation at scale:
Trigger on behavior, not on time. A user who stalls on a depth-adoption feature gets a re-engagement nudge when the stall is detected, not on a calendar-based schedule set before the stall occurred. A user who logs in after a three-week absence gets a "here is what changed while you were away" flow, not a generic "we miss you" email.
Personalize at the cohort level, not the persona level. Adoption strategies that respond to what a specific user has done — which features they have touched, how frequently they return, where they stall — outperform strategies built around what a job-title group is assumed to need at a given point in their subscription. The behavioral signal is more accurate than the signup-form attribute.
Automate the routine; keep human judgment in the strategic. CS involvement in adoption should be triggered by the product's behavioral signals — an account health score dropping below a threshold, a champion seat going dark without a secondary user taking over — not by a calendar of scheduled touchpoints. This preserves CS capacity for the accounts and moments where human judgment produces outcomes that automation cannot.
For the forward-looking view on where AI-driven adoption automation is heading, Jimo's autonomous onboarding analysis covers the agent-level picture.
Where to Start When Your Adoption Curve Is Flat
The four stages are not equally urgent for every product. The right starting point depends on where your specific curve is breaking down. Use the following diagnostic to identify the highest-impact intervention for your current situation.
If DAU/MAU is low despite strong initial activation: Stage 1 is the problem. Users activated and did not return because they did not discover a reason to. The product did not surface the next value moment before their initial curiosity expired. Start with behavioral announcement routing and contextual feature discovery guidance.
If feature discovery breadth is acceptable but 60-day feature retention is deteriorating: Stage 2 is the problem. Users found the features but did not build habits around them. Milestone tracking, success visibility, and behavioral re-engagement nudges are the interventions. Start with the checklist product and behavior metrics to identify which features have the largest discovery-to-habit gap.
If individual metrics look healthy but expansion revenue is stalled: Stage 3 is the problem. The champion is adopted; the account is not. Account-level penetration reporting and role-specific flows for secondary users are the interventions. Start with actionable reports to surface which accounts have the highest single-champion concentration risk.
If churn is coming from tenured users rather than new cohorts: Stage 4 is the problem. Long-term users are experiencing feature drift or encountering changed product surfaces without guidance. Encounter-triggered re-onboarding and usage health scoring are the interventions. Start with retention insights to identify which features are showing the steepest abandonment curves in your 90-day-plus cohorts.
If you are unsure which stage your curve is breaking at: Run the five-step experience audit from Jimo's customer onboarding experience guide against your current adoption data. The qualitative signals — NPS verbatims, support ticket language, user interview notes — will surface the stage faster than the quantitative data alone.
Teams ready to build a strategic framework around their entire adoption practice (including model choice, channel mix, and primary metric selection) will find that structure in Jimo's SaaS onboarding strategy guide. Teams looking to audit the specific practices that feed into their adoption program against the 2026 AI-native standard will find that in Jimo's product onboarding best practices guide.
Adoption Is Not a Moment — It Is a Practice
Teams that treat product adoption as a one-time event, something that happens during onboarding and is resolved once a user activates, will always have flat adoption curves. The activation metric will look healthy. The retention cohorts will tell a different story.
The four-stage framework in this article is not a project to complete. It is a discipline to operate. Feature discovery strategies need updating as the product surface expands. Depth adoption metrics need reviewing as usage patterns shift. Team-level adoption gaps need monitoring as account structures change. Sustained adoption health needs tracking as the product evolves and the market around it does too.
None of that requires scaling a CS team. It requires building the behavioral infrastructure that lets the product act intelligently at each stage, surfacing the right guidance to the right user at the right moment in their lifecycle, without a human in the loop for every intervention.
The teams that build that infrastructure first will have a compounding advantage in feature retention, account expansion, and long-term revenue per user. Not because they have a better adoption philosophy, but because their product responds to users faster than competitors' products do.
Book a demo to map the diagnostic against your current adoption data. See Jimo's pricing for teams evaluating fit.
FAQ
What are the best practices for driving product adoption in B2B software?
The most effective practices follow a stage-specific logic: different strategies for Feature Discovery (surfacing secondary features to users whose behavior signals readiness), Depth Adoption (building habits through milestone tracking and behavioral re-engagement), Team-Level Adoption (expanding from champion to full account through role-specific flows and account-level reporting), and Sustained Adoption (preventing feature abandonment through encounter-triggered re-onboarding and usage health scoring). Applying the same strategy across all four stages is the most common adoption mistake in B2B product teams.
How is product adoption different from user onboarding in B2B SaaS?
Onboarding addresses the first-session experience: getting a new user to their first value moment. Product adoption addresses everything that happens after that moment: whether users discover and use secondary features, whether they build habits around the features they do discover, whether adoption spreads across the account beyond the initial champion, and whether long-term users stay engaged as the product evolves. Onboarding strategies optimize for a moment. Adoption strategies optimize for a lifecycle.
What are the best user engagement strategies for product adoption software?
Behavioral triggering consistently outperforms time-based or persona-based engagement strategies. The three principles that drive the highest engagement rates in B2B adoption programs: triggering on observed user behavior rather than calendar schedules, personalizing at the cohort level based on actual usage patterns rather than assumed needs by job title, and automating routine re-engagement while reserving human CS judgment for the moments where it produces outcomes automation cannot. Products that respond to what users actually do, not what they signed up saying they would do, produce adoption engagement that compounds rather than decaying over the subscription lifecycle.
How do you measure product adoption at different stages of the user lifecycle?
Each stage requires a distinct primary metric. Feature Discovery: feature activation rate by cohort, measuring what percentage of users have engaged with each secondary feature at least once. Depth Adoption: feature retention rate at 30, 60, and 90 days, measuring whether discovered features become consistent habits. Team-Level Adoption: account feature penetration rate, measuring how many seats in an account are actively using each key feature vs. how many have access to it. Sustained Adoption: usage health score trend, measuring whether adoption is stable or deteriorating for users who have been active for 90 days or more. Tracking all four simultaneously gives a complete picture of where the adoption curve is holding and where it is breaking down.