TL;DR
Feature adoption is the process by which users move from being exposed to a specific capability to using it repeatedly as part of their regular workflow — and for most B2B SaaS product managers, the gap between shipping a feature and actually getting users to adopt it is where roadmap ROI quietly disappears. This guide covers what feature adoption means at the feature level specifically (not product adoption broadly), how to calculate the feature adoption rate using the correct formula, the two metrics that tell you whether your adoption problem is a discoverability issue or a value issue, why users drop off at each stage of the feature adoption funnel, and five strategies for driving adoption without waiting on a sprint cycle. By the end, you will have a diagnostic framework for identifying exactly where adoption breaks for any given feature, and a clear picture of what it takes to close the gap between spotting the problem and shipping a fix.
Customer Alliance increased feature adoption by 970%. The mechanism was not a redesign, a new feature, or a repositioning exercise. It was closing the gap between knowing which users had not adopted a capability and being able to reach them with relevant, contextual guidance at the exact moment they needed it.
Most product managers reading this can pull a feature adoption rate from their analytics tool. Fewer can tell you which user segment is furthest from adopting the feature you shipped last quarter, what is specifically blocking them, and what is already deployed to fix it. That gap between having the data and being able to act on it at the feature level is the problem this guide is built around.
Before going further: if you are looking for how to define and measure product adoption across your entire product, that framework lives in our product adoption metrics guide. If you need the organizational playbook for building a cross-functional adoption strategy, who owns which funnel stage, how handoffs work, how to run a review cadence that keeps teams aligned — that is covered in our product adoption strategy guide. And if your starting point is increasing product adoption overall, the ROI model and intervention playbook are in how to increase product adoption.
This guide is scoped to one layer: a single feature, a specific user cohort, and the execution loop that moves adoption for that feature without touching your broader onboarding flow and without a sprint dependency.
What Is Feature Adoption? (and Why the Definition You're Using Is Probably Costing You)
You shipped the feature. It works. The release notes went out, the changelog got updated, and the activation data shows users are finding it. And yet six weeks later, the usage curve has barely moved.
If that pattern is familiar, the issue is almost certainly not the feature. It is where you drew the line between "adopted" and "not adopted,"and specifically, whether that line is sitting at the wrong stage of the funnel.
Most teams measure adoption at the activation stage: the user found the feature, the user engaged with it, the metric moved. That is a reasonable thing to track. It is not adoption. Activation tells you a user experienced the feature once. Adoption tells you they came back to it on their own, without a tooltip pointing them there, because it has become part of how they work. The funnel has four stages: exposed, activated, used, used again, and the only one that constitutes adoption is the fourth. Every stage before it is a precondition.
That distinction has a direct operational consequence. A feature with strong activation and low return usage has a value problem: users found it, got nothing sticky out of the first interaction, and did not come back. A feature with low activation has a discoverability problem: users are not finding it at all. Those two diagnoses call for completely different interventions, and running the wrong one does not just fail to move the metric, but it wastes the sprint capacity you spent getting access to engineering in the first place.
The definition question to answer before pulling any feature adoption data: at what point does a user's behavior tell you that this feature has changed how they work, not just that they clicked on it? That threshold, specific to the feature, specific to the workflow it supports, is what your adoption rate should be measuring. The next section shows how to build the formula around it.
The Feature Adoption Rate Formula (and the Denominator Decision That Makes or Breaks It)
The formula is straightforward. What precedes it is where most teams go wrong.
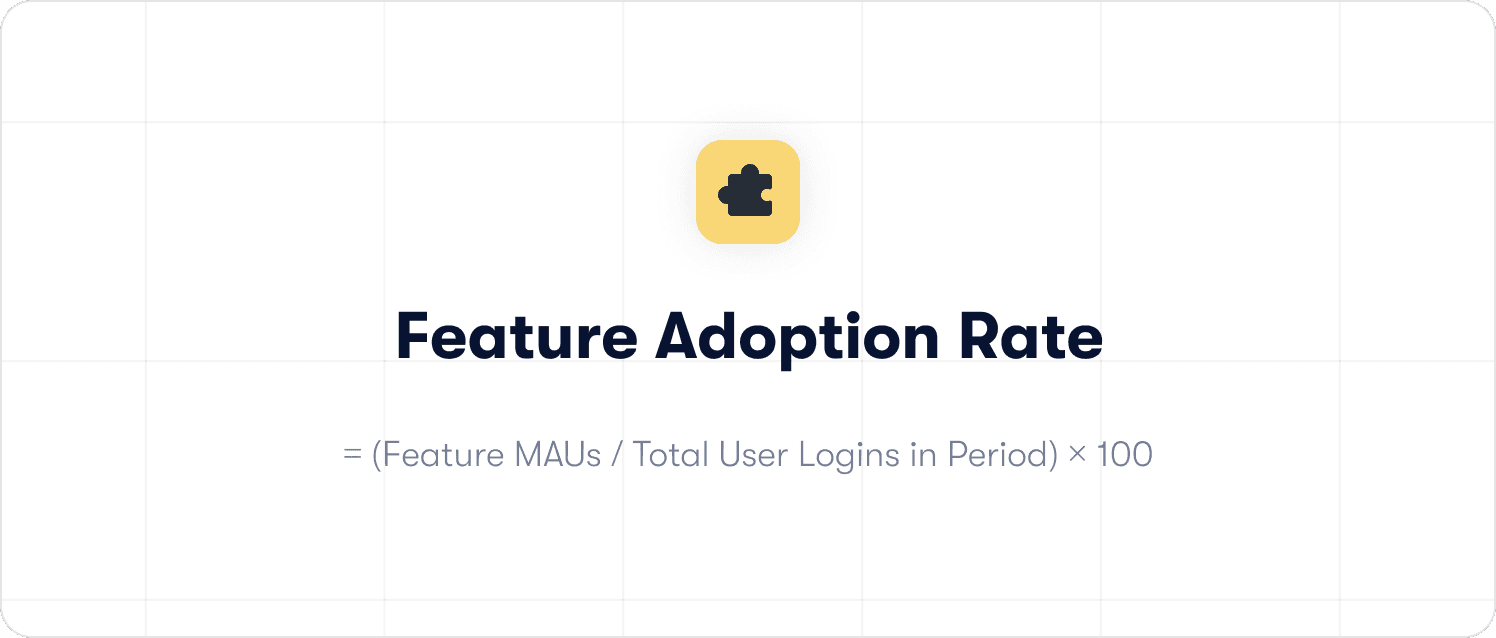
Feature Adoption Rate = (Feature MAUs / Total User Logins in Period) × 100
Two decisions determine whether the output is useful.
Decision 1: Define your adoption criterion before you calculate. What specific behavior signals that this feature has become part of the user's regular workflow? Set the threshold first. The right answer is different for every feature.
Decision 2: Segment your denominator. If your denominator includes every user who logged in during the period, regardless of plan tier, role, or feature access, your rate will understate actual adoption among the cohort that matters. Segment before you calculate.
With both decisions made, the formula becomes a diagnostic tool. If 180 of 600 eligible users completed the defined adoption action in a given month, your feature adoption rate is 30%, and you have a precise question to answer: what happened to the other 420?
Feature Adoption Metrics: The Feature-Level View
If you need the product-level adoption metrics dashboard, covering activation rate, time-to-value, and workflow completion rate, that framework is in the product adoption metrics guide. What follows is the feature-specific translation: the two metrics that give you the funnel analysis at the feature level.
Adoption by Segment
Your aggregate feature adoption rate is orientation, not diagnosis. A 30% rate looks acceptable until you segment it and find that power users on your top-tier plan are adopting at 68% while new users in their first 14 days are sitting at 9%. Those two cohorts have completely different problems, and a single intervention aimed at "improving adoption" will not move either of them.
Group your users into four adoption cohorts and apply a different diagnostic question to each:
New users (first 14 days): Low adoption here is almost always an exposure failure. Your feature shipped, but these users are encountering it, if at all, outside the moment in their workflow when it would be relevant. An email announcement or a release note is not reaching them at the right time. Before you build a better feature experience, confirm they are finding the feature at all, and when.
Power users (6 or more months in your product): Low adoption here is almost never a discoverability problem. These users know your product. If they have not adopted a feature, the question is whether it solves a problem they actually have, or whether the workflow it requires conflicts with habits they have already formed. A tooltip is not going to fix that. A closer look at the first session data will tell you more than another announcement.
Churned feature users: Users who adopted and then stopped. Something changed: the feature introduced user friction, their workflow shifted, or a competing solution displaced it. This is the most diagnostic cohort you have access to, because the drop-off is specific and timestamped. Until you know what changed and when, you are guessing at the intervention. Start with the timing before you start with the message.
At-risk accounts: Users whose feature usage has declined over the past 30 days without a clear trigger. The window for a low-effort intervention here closes faster than most PMs expect. Act on this cohort before they become churned feature users, not after.
Feature Retention
Feature retention measures the percentage of users who interact with your feature for the first time and return to it within 14 or 30 days, without being prompted. Tracking it separately from overall product retention is what gives you the specificity to know which problem you are actually solving.
If your feature has strong initial activation but low feature retention, you have a value failure. Users found the feature, engaged with it once, and decided not to return. That is a signal about what happened during that first session, not about how well you announced the launch. The habit never formed because the first interaction did not give them a concrete enough reason to come back. Running another announcement campaign will not move this number.
If your feature has low initial activation and low feature retention, you have a discoverability failure compounding a value failure. Address them in that order. There is no point refining the first session experience if users are not reaching it.
The diagnostic value of feature retention is not in the rate itself. It is in what the rate tells you about which intervention to run next, and which ones to skip.
Feature Adoption Strategies for B2B SaaS Product Managers
The strategies below are organized by funnel stage and written for a PM who does not have unlimited engineering availability. Each one is built around the execution gap: the delay between identifying a feature adoption problem and being able to act on it.
For the organizational question of how to govern and sequence interventions across teams, that framework is in the product adoption strategy guide.
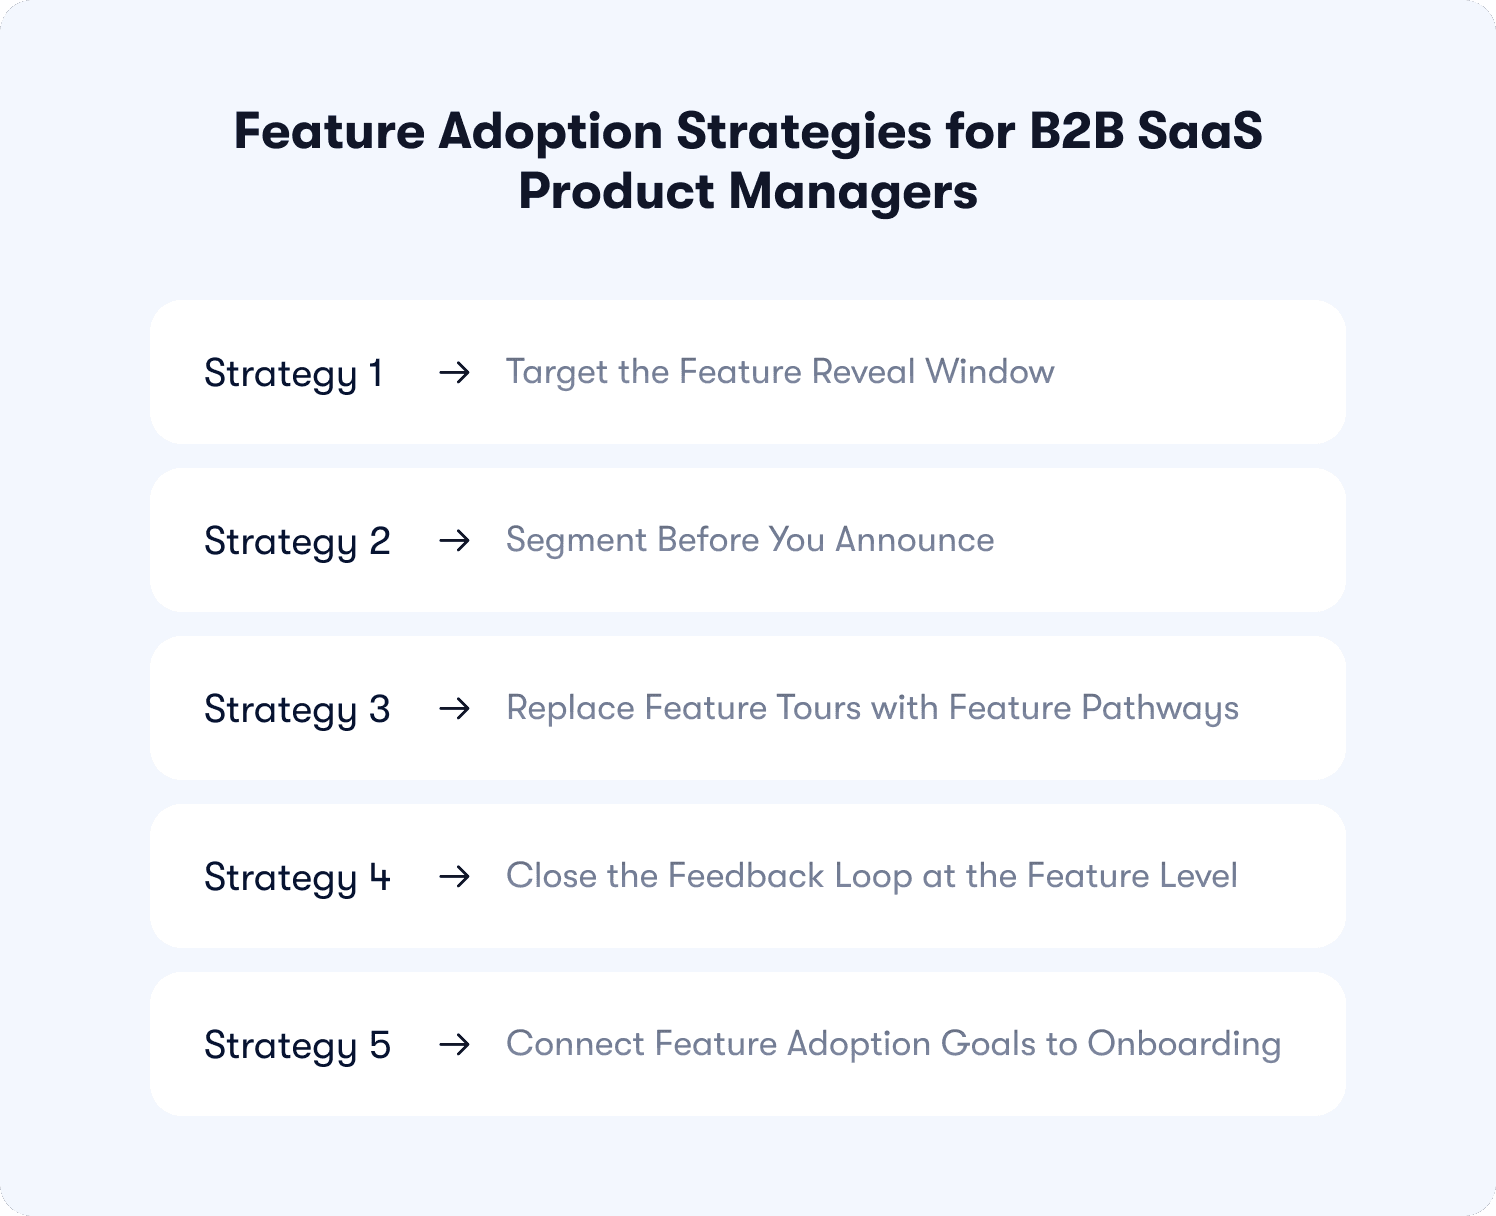
Strategy 1: Target the Feature Reveal Window
There is a narrow behavioral window, typically within the first 7 to 14 days post-signup or immediately after a user completes an adjacent action, where the probability of feature adoption is at its highest. Most teams miss it because their announcement logic is time-based rather than behavior-based. An in-product prompt that fires on day three reaches every user on day three regardless of what they are doing. A prompt that fires when a user completes the workflow that makes your feature immediately relevant reaches a user who is already primed to see the value.
The difference in adoption impact between those two trigger types is not marginal. A user who encounters your feature at the moment it solves a problem they are actively experiencing is in a fundamentally different state than a user who encounters it on a schedule your team decided in a planning meeting.
The strategic decision is whether your intervention logic is built around what your users are doing or around when your team is ready to communicate. If it is the latter, that is where the adoption gap starts.
Strategy 2: Segment Before You Announce
A feature announcement sent to your entire user base is not a feature adoption strategy. It is a broadcast. The users who need to hear about the feature are not the same users who already use it regularly, and they are not in the same moment of their workflow when the message lands.
Before any in-product communication goes out for a feature, identify which adoption cohort you are targeting and what that cohort's specific barrier is. New users who have not been exposed to the feature need a different message, in a different format, at a different moment than power users who have encountered it but not returned. Building one announcement for both cohorts will underperform for both.
The cohort framework from the metrics section is your segmentation model here. Each cohort already has a diagnosed failure mode. The announcement you build should be a direct response to that failure mode, not a general feature highlight.
Strategy 3: Replace Feature Tours with Feature Pathways
A feature tour shows your user what the feature looks like. A feature pathway requires them to complete a meaningful action inside it before they can advance. The distinction sounds small. The impact on adoption is not.
When a user completes a tour, they have seen the feature. When a user completes a pathway, they have used it. Those are not the same behavioral outcome, and only one of them creates the foundation for a return visit. A user who has performed a real action inside a feature, and seen a real result from it, has a concrete reason to come back. A user who has clicked through five tooltips and a modal does not.
Building feature pathways rather than feature tours requires one structural change to how your guidance is built: progression should be conditional on user action, not on user clicks. The user advances when they do the thing, not when they confirm they have read about it.
Strategy 4: Close the Feedback Loop at the Feature Level
Your feature adoption rate tells you what happened. It does not tell you why. A micro-survey deployed at the feature level, triggered at the right moment in the user's interaction with the capability, gives you the qualitative signal that the quantitative data cannot. Did the user not return because the feature did not solve their problem, because the workflow was too complex, or because they found a workaround elsewhere? Those three diagnoses have three different fixes, and you cannot tell them apart from a usage drop alone.
The feedback loop that matters here is specific to the feature, not the product. A generic NPS survey does not surface feature-level friction. A two-question prompt, triggered after a user's second interaction with a specific feature, or after a defined period of inactivity from it, gives you the signal you need to iterate without guessing.
Pairing feature-level behavioral data with feature-level feedback is what separates a PM who is iterating on evidence from one who is iterating on assumptions.
Strategy 5: Connect Feature Adoption Goals to Onboarding
For features that are core to your product's value proposition, waiting until after onboarding to drive adoption is too late. The habit formation window for a new user is short, and if a critical feature is not part of their first meaningful experience in the product, the probability that they discover and adopt it later drops significantly.
This does not mean overloading your onboarding flow with every feature you want users to adopt. It means identifying the one or two features whose early adoption most reliably predicts retention, and building a path to them into the onboarding sequence.
📖 For a full treatment of how to structure that, the 19 tactics playbook covers the onboarding-to-activation sequence in depth. The point here is narrower: feature adoption planning should start at the onboarding design stage, not after the launch post-mortem. Get your free guide now!
What Is a Good Feature Adoption Rate? Benchmarks and How to Set Your Own Target
This is the question most PMs ask first and should ask third, after they have defined their adoption criterion and segmented their denominator. A benchmark number without those two decisions in place is not a target. It is a distraction.
With that said, benchmarks are useful for orientation and for building the business case when you need to explain to leadership why the current rate is a problem worth resourcing.
Industry benchmarks suggest the average core feature adoption rate sits at 24.5%, with a median of 16.5% across SaaS products. Those figures vary significantly by product category: HR tools trend toward 31%, while FinTech and Insurance products sit closer to 22.6%. Sales-led companies tend to see higher core feature adoption rates than product-led ones, partly because sales-led onboarding involves more direct guidance toward specific features during the early relationship.
Two things are worth noting about those numbers before you use them in a planning conversation. First, they measure core feature adoption, meaning the features central to a product's primary value proposition. If you are measuring adoption of a secondary or advanced feature, you should expect a lower rate and set your targets accordingly. Second, the benchmark is only comparable if your adoption criterion and denominator are defined the same way. A team measuring any feature interaction as adoption will show a higher rate than a team measuring repeat, workflow-embedded usage. Neither is wrong. They are not the same measurement.
The more operationally useful approach is to treat your current rate for a comparable feature as your baseline, then set a 60 or 90-day improvement goal relative to that baseline. If you want a structured process for running that comparison against industry standards across your full adoption funnel, the product adoption benchmarking analysis guide covers the five-step methodology in full. The question that actually moves the feature adoption metric is not whether you are above or below an industry average. It is what specifically is blocking your next 10 percentage points, and how quickly you can test a fix. That is what the final section addresses.
From Feature Adoption Data to In-Product Fix: What the Loop Looks Like at the Feature Level
Closing a product-level adoption gap and closing a feature-level adoption gap are not the same operation. The product-level version involves a cross-functional conversation, a sprint allocation, and a rollout that touches your entire onboarding flow. The feature-level version should not. When you have identified that a specific cohort is stalling at a specific stage for a specific feature, the intervention needs to be scoped to exactly that problem — and it needs to ship before the adoption window for that feature closes.
That scoping requirement is what makes feature-level execution different from everything covered in the broader adoption playbooks. It is not about having better tools or faster engineers. It is about whether your intervention logic can operate at the granularity the problem actually exists at.
Four things determine whether it can.
Targeting at the feature level, not the product level. The intervention should fire for users who have not adopted this specific feature, within the cohort where the drop-off is occurring, on the plan tier where the feature is available. A product-level trigger that fires for all users who have not completed onboarding will reach users who have already adopted the feature, users who do not have access to it, and users whose stall point is somewhere else entirely. That is not a fix. It is noise that obscures the signal you are trying to move.
Trigger logic built around what the user is doing, not when the calendar says to fire. Product-level announcements are typically time-based: day three, day seven, day fourteen. Feature-level interventions need to be behavior-based: the prompt fires when a user completes the adjacent workflow that makes your feature immediately relevant, not on a schedule your team set in a planning meeting two weeks before launch. The difference in receptivity between those two moments is not marginal. A user actively working through the problem your feature solves is primed. A user receiving a nudge while doing something unrelated is not.
Deployment that does not require a sprint. At the product level, a two-week queue between identifying a drop-off and shipping a fix is disruptive but survivable. At the feature level, it is fatal to the intervention. The adoption window for a specific feature, particularly in the first two weeks after launch, closes faster than most sprint cycles complete. The PM needs to build, test, and deploy the feature-level fix in the same week the data surfaces the problem. If that requires a Jira ticket, the window will be closed before the ticket is resolved.
Feedback scoped to the feature, not the product. A generic NPS survey or a product-level feedback prompt will not tell you why a specific cohort stopped returning to a specific feature after their first interaction. A two-question in-app survey triggered after a defined period of feature inactivity, scoped to the users who activated but did not return, gives you the qualitative signal that the behavioral data alone cannot provide. Without it, your next iteration is a guess dressed up as a hypothesis.
Jimo is built for exactly this scope of work, combining behavioral analytics and in-product execution in one platform so the loop from feature adoption signal to deployed fix operates at the feature level, without engineering dependency and without touching your broader onboarding flow. If you want to see what that looks like against your specific adoption problem, see Jimo in action.
What this guide gives you is enough to move the number for one feature, one cohort, one sprint. When you are ready to make that system work across multiple features, multiple teams, and a review cadence that keeps the whole operation calibrated to outcomes rather than activity, the product adoption strategy guide is where to go next.
FAQs
Our feature adoption rate looks fine in aggregate but retention is still flat. Where do I look first?
Segment the rate before drawing any conclusions from the aggregate. A 28% feature adoption rate that is 54% among your top-tier paid accounts and 9% among new users in their first 14 days is not a single problem. It is two separate problems with two different diagnoses and two different interventions. The aggregate number is hiding one of them. Pull the rate by adoption cohort, identify which segment is furthest from where it needs to be, and start the diagnostic there.
How do I know whether a low feature adoption rate is a discoverability problem or a value problem?
Look at feature retention alongside your activation numbers. If initial activation is low, users are not finding or engaging with the feature at all — that is a discoverability problem, and the intervention is earlier and more prominent exposure at the right moment in the workflow. If initial activation is solid but feature retention at 14 or 30 days is low, users found the feature and tried it but did not come back. That is a value problem, and the intervention is a closer look at what the first session experience actually delivers, not another announcement.
How quickly should I expect feature adoption to move after deploying an in-product intervention?
For exposure and activation interventions targeting new users, directional signal should be visible within 7 to 14 days if your cohort volume is sufficient. Feature retention takes longer to move meaningfully — plan for a 30-day window before drawing conclusions on whether the intervention changed return behavior. The mistake most PMs make is measuring too early on retention and too late on activation. Check activation signal in the first two weeks, then let the retention data develop before deciding whether to iterate or move on.
What is the minimum viable measurement setup I need before a feature adoption strategy is worth running?
Three things: a defined adoption criterion for the specific feature, a segmented denominator that excludes users without access to the feature, and the ability to track return visits to the feature separately from first interactions. Without the adoption criterion, your rate is measuring the wrong behavior. Without the segmented denominator, your rate is measuring the wrong population. Without return visit tracking, you cannot distinguish a discoverability problem from a value problem, and you will run the wrong intervention every time.