How Interactive Product Tours Accelerate SaaS Sales Cycles: 7 Proven Benefits (+ ROI Framework)
How Interactive Product Tours Accelerate SaaS Sales Cycles: 7 Proven Benefits (+ ROI Framework)
How Interactive Product Tours Accelerate SaaS Sales Cycles: 7 Proven Benefits (+ ROI Framework)
/
8 mins read

TL;DR
Getting budget approval for adoption platforms requires proving ROI to multiple stakeholders—your CPO needs retention data, CS needs ticket deflection proof, finance needs payback calculations. This article gives you the measurement framework to connect tours to revenue outcomes, the 7 benefits to quantify in your business case, and the stakeholder playbook to compress alignment cycles by 20-30%.
You're a PM at a 200-person SaaS trying to get budget approval for an adoption platform. Tool evaluation isn't your current problem. It's internal alignment.
Your Head of Product won't sign off without retention data. Your Customer Success lead needs ticket deflection proof. Finance wants a payback period calculation. Engineering wants to know this won't create technical debt.
By the time you realize it, you've burned a week between each thread of conversation and calendar syncs. Four stakeholders, four separate meetings to show the same platform from four angles. Two weeks stretches into six. Your activation numbers keep sliding while you play calendar Tetris.
Interactive product tours solve both problems. They compress internal approval cycles (20-30% faster stakeholder alignment), accelerate user activation cycles (up to 40% reduction in time-to-first-value), and speed product iteration cycles (from 3-month dev queues to same-week launches). This article gives you the ROI framework to quantify each acceleration and the presentation templates to justify the investment.
Why Proving Interactive Tour ROI Is Harder Than It Should Be
Most tour platforms give you vanity metrics. 83% completion rate. 2,000 tour views. 4.2 average steps completed. None of this answers the question your CFO will ask: "Did the users who completed tours convert to paid accounts at higher rates?"
The measurement gap exists because tour platforms treat guidance as isolated from business outcomes. The platform you choose needs to close this attribution gap automatically. If you're manually instrumenting events, exporting CSVs, and building dashboards to prove tour impact, you've added a week of work to every business case update.
ROI Measurement Framework: Connect Tour Engagement to Revenue Outcomes
Leadership breathes concrete numbers, which means you need to know whether your users activated, retained, or converted to paid. Use this framework below to connect your tour engagement to metrics that actually justify investment.
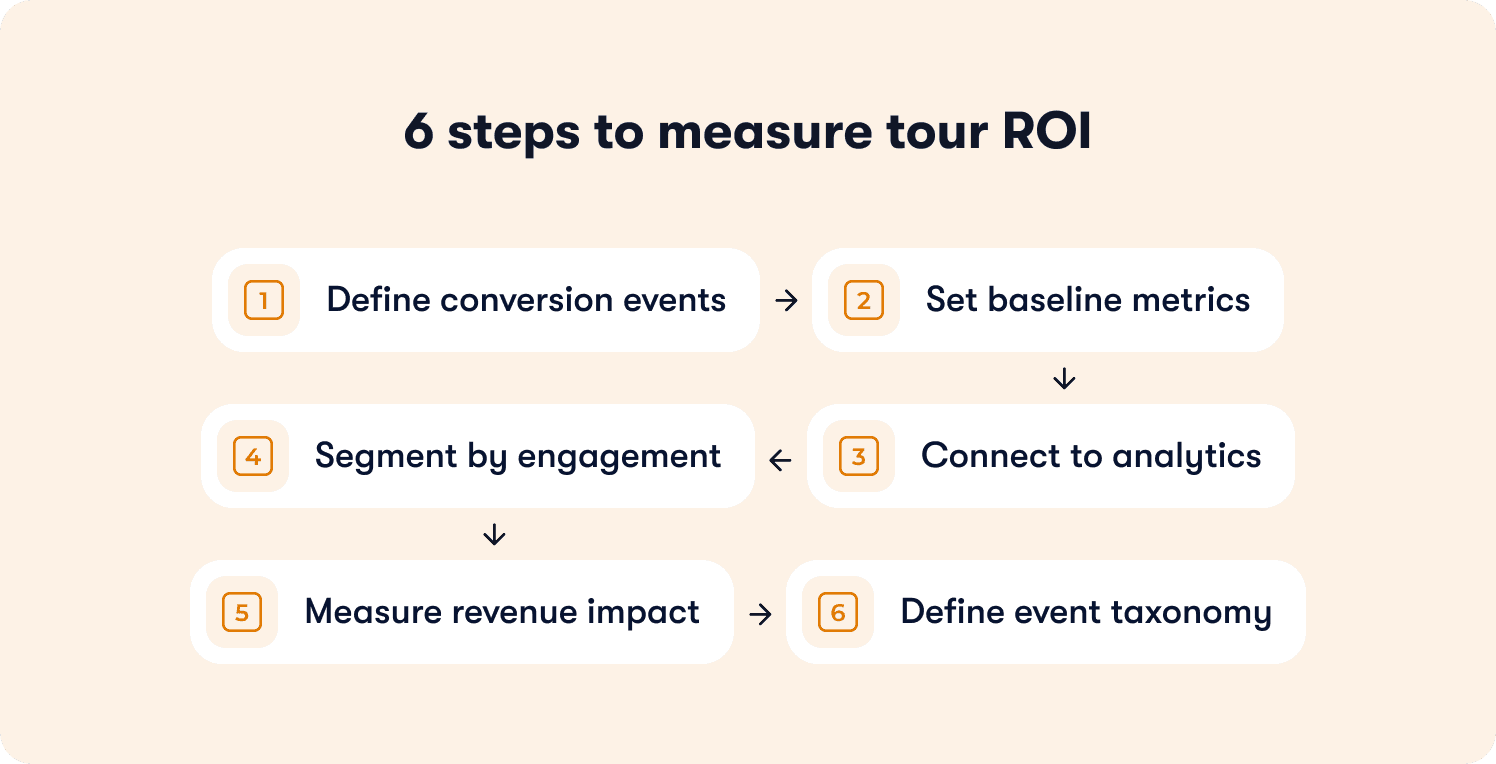
Step 1: Define tour events that predict conversion
Tour start and tour completion are vanity metrics. They tell you someone saw your guidance and clicked through. However, they don't tell you whether they activated.
The events that predict conversion are high-intent actions:
Viewed pricing section
Invited a teammate
Connected an integration
Completed setup checklist
Created their first project or dashboard
Explored advanced feature documentation
Known as behavioral signals, users who complete these steps during a tour are signaling purchase intent or activation readiness. Track these as distinct events, not as a single "tour completed" metric.
Step 2: Establish baseline metrics before implementation
You need a before state to measure against. Track these metrics for at least two weeks before launching tours:
Activation rate (percentage of signups who reach your activation milestone)
Trial-to-paid conversion rate
Time-to-first-value (median days from signup to activation)
CS ticket volume per new account
CS hours spent on manual onboarding per account
30-day retention rate
Without baselines, you're guessing whether tours moved metrics or whether natural variance explains the change. Your CFO will ask for baselines. Have them ready.
Step 3: Connect tour events to your analytics stack
Tour data needs to flow into the same system where you track activation and retention. If tour events live in one platform and product usage lives in another, you're manually bridging the gap every time you want to prove impact.
Jimo pushes events natively to Segment, Mixpanel, or your own data warehouse. If you're using Jimo's built-in Success Tracker, no additional setup is required. The platform connects tour completion to activation milestones automatically.
If your analytics stack doesn't support native integrations, you're adding technical dependency that slows iteration. Every new tour requires engineering work to instrument events. This matters when you're trying to iterate based on what's working—waiting two weeks for event tracking means you can't optimize during the evaluation window.
Step 4: Segment users by tour engagement level
After tours have been live for at least 30 days, segment users into cohorts:
Completed tour: Finished all steps and required actions
Partial completion: Started but dropped off
No engagement: Never saw or dismissed the tour
Compare baseline metrics across these segments. If users who completed tours activated at 45% versus 40% for non-completers, that's a 12.5% lift.
Step 5: Calculate cost savings and revenue impact
Present results with both percentage lift and dollar impact. Your CFO thinks in dollars, not percentages. See the "How to Present These Findings to Your CFO" section below for complete calculation templates and presentation format.
Step 6: Event taxonomy that makes attribution obvious
Your event naming should make it easy to trace user journeys from tour engagement to activation to revenue. Use this structure:
tour_started- User saw the tourtour_completed- User finished all stepstour_step_completed: invite_teammate- User completed specific actiontour_step_completed: view_pricing- User viewed pricingtour_step_completed: connect_integration- User connected integrationtour_step_completed: complete_setup- User finished setup checkliststakeholder_share- User shared tour with internal stakeholder
Each event should include metadata: user ID, timestamp, tour ID, step ID, account tier. This lets you segment by plan type when presenting to finance.
To simplify these processes, Jimo's Success Tracker captures these events and connects them to activation milestones via no-code event tagging so PMs don't need to involve engineering to close the attribution loop.
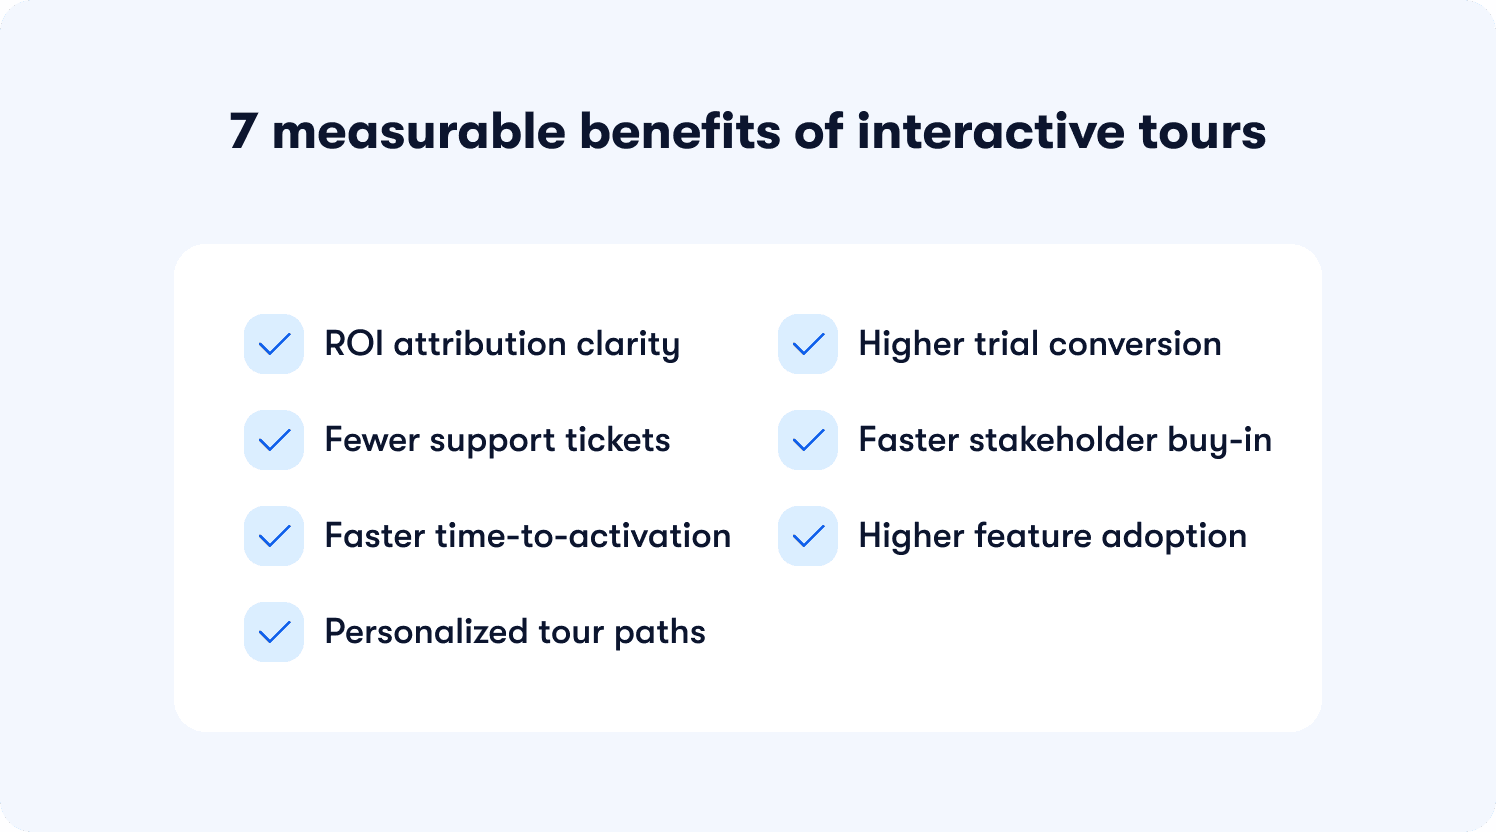
7 Measurable Benefits That Justify Interactive Tour Investment
These benefits are ordered by what gets budget approved: revenue impact first, cost savings second, efficiency gains third. Each includes the mechanism (how it works), the business outcome (what it delivers), and the measurement approach (how to quantify it for your CFO).
1. Prove ROI with Attribution Models That Connect Tours to Revenue
The mechanism: Tour engagement events (start, key-step completion, high-intent actions like "invited teammate" or "viewed pricing") get captured and connected to downstream activation and retention metrics.
The platform should handle this connection via no-code event tagging. If you're manually instrumenting events and pushing them to Segment or Mixpanel, you've added technical dependency that slows iteration and makes it harder to prove ROI during the evaluation period.
Product and GTM leaders can show a clear attribution path: "Users who completed the tour's invite-teammate step had 2.3x higher activation rates and 40% faster time-to-paid conversion." This is the difference between reporting tour views and proving business impact.
Business outcome: PMs and CPOs can prove interactive tour ROI to leadership with attribution that connects guidance interactions to activation, retention, and expansion outcomes—not just tour completion percentages.
This is the proof point you show in budget discussions. Vanity metrics (83% completion rate) don't justify investment. Attribution to conversion and retention does.
How to measure it: Define key tour events (start, key-step completion, high-intent actions) and connect them to your activation and retention tracking. Track time-to-first-value, activation rate, and trial-to-paid conversion for users who completed tours versus those who didn't, segmented by plan or account type.
The platform should push these events to your analytics stack natively. For example, Jimo integrates with Segment, Mixpanel, and major analytics platforms through integrations, or you can use the built-in Success Tracker if you don't want to maintain separate analytics infrastructure for actionable reports.
2. Improve Trial-to-Paid Conversion with Action-Based Guidance
The mechanism: Action-based tours auto-progress based on real user interactions—clicks, page conditions, form inputs—rather than passive "Next" button taps. Users complete the actual activation behavior (create a dashboard, invite a teammate, set up an integration), not just the tour.
Most tour platforms let users click through without doing anything. Completion rate looks good but activation stays flat. Tours that require real interaction force the behavior that drives conversion.
The platform should adapt these flows automatically when user behavior changes. Manual reconfiguration after each release kills momentum—and makes it impossible to iterate during a trial period when you're trying to prove value quickly.
Business outcome: Jimo customer data shows up to 15-25% improvement in trial-to-paid conversion because tours guide users to their first success event rather than explaining features. Your results will depend on how well the tour maps to your actual activation event.
Florian Labadens, SVP Product at Zenchef, put the stakes clearly: "We know that if onboarding takes more than 30 days, we are twice as likely to lose that customer within six months." Using product tours and onboarding checklists, Zenchef compressed onboarding from 30 days to 14 days—every day shaved off directly prevented churn. Read Zenchef's journey with Jimo.
How to measure it: Track activation rate (users who completed the tour's key activation step) against trial-to-paid conversion rate. Segment by tour completion versus non-completion to isolate impact.
The platform should connect tour completion events directly to activation milestones without manual CRM mapping. If you're manually tagging events and pushing them to your analytics stack, you've added friction that slows iteration.
3. Reduce CS Intervention and Support Tickets with Scalable Product Education
The mechanism: Interactive tours handle repetitive product education—basic feature walkthroughs, integration overviews, account setup flows—so CS teams don't cover the same ground on onboarding calls.
The scalability piece matters when justifying cost. If launching and iterating tours requires engineering sprints, product education doesn't scale without adding CS headcount. The platform should let GTM teams deploy and adjust tours without technical dependencies using onboarding process tools that don't require code.
This frees CS capacity for high-value conversations: expansion discussions, strategic account reviews, proactive churn prevention. CS stops being the onboarding bottleneck and becomes a growth driver.
Business outcome: Jimo customer data shows up to 40% reduction in CS intervention and support tickets because users resolve common questions through self-serve tours before they raise a ticket or request a call.
How to measure it: Track support ticket volume per account before and after tour implementation. Segment by tour completion rate and compare CS hours required for accounts where users completed tours versus those who didn't.
Connect tour engagement to early churn signals. Users who don't complete onboarding tours are often the same accounts that churn at 30-60 days. Jimo's retention insights surface these patterns automatically.
4. Reduce Internal Alignment Time Through Async Stakeholder Education
The mechanism: Instead of scheduling separate walkthroughs to explain the same product to a CPO, a CS lead, and a finance approver, a champion shares a single tour link. Each stakeholder sees a personalized path based on their role. CPO sees ROI proof. CS lead sees onboarding depth. Finance sees pricing clarity.
This works for both external sales cycles and internal approval processes. The friction is identical whether you're convincing a prospect's buying committee or your own leadership team.
The platform should create these separate paths from one tour link without engineering support. If you're building five separate tours for five stakeholders, version control becomes a nightmare.
Business outcome: Jimo customer data shows up to 20-30% compression in internal alignment cycles because stakeholder education happens in parallel, not sequentially. Weeks of calendar coordination get replaced by a single async touchpoint. Your results will vary by deal complexity and stakeholder count.
How to measure it: Track time from champion signup to internal approval decision for leads who used a shared tour link versus those who went through sequential demo calls. Segment by deal size.
Track which stakeholder personas complete which tour steps. Correlate completion with stage progression. Did the stakeholders who viewed pricing advocate for budget approval? Did accounts where multiple stakeholders engaged move faster?
5. Accelerate Self-Serve Discovery and Reduce Time-to-Activation
The mechanism: Interactive tours let users explore the product on their own timeline, surfacing features relevant to their role and use case without requiring a live demo.
The key differentiator is behavioral triggering. Tours that fire generically at signup get ignored. Tours that surface at the exact moment users are ready to act—showing an integration tour when a user creates their third dashboard, for example—arrive when context makes them relevant.
This self-serve exploration does two things that matter for justifying investment. Users reach their first value moment faster because they're not waiting for scheduled demos. Product teams can prioritize follow-up for users who completed high-intent tour steps (viewed pricing, explored integrations, invited teammates) rather than treating all signups equally.
Business outcome: Time-to-activation can accelerate by up to 30-40% because users aren't blocked by demo scheduling and they're guided directly to activation behaviors that matter. The upper end of this range comes from products with clear activation moments and well-defined behavioral triggers.
Morgane Ruaud, Product Design Team Lead at AB Tasty, described the before state: her team waited over three months for engineering resources to launch feature communications. After implementing Jimo, their launch cycle compressed to 2 weeks. The first campaign launched in 90 minutes and reached 2,000 users in week one. Read AB Tasty's journey with Jimo.
How to measure it: Track tour engagement events (start, key-step completion, high-intent actions) and correlate with activation rate and trial-to-paid conversion. Segment by tour engagement level to identify which steps signal strongest purchase intent.
The platform should surface these patterns automatically using behavior metrics. If you're manually running cohort analysis to figure out which tour steps predict conversion, you're spending time on reporting instead of iteration.
6. Increase Feature Adoption Rates with Contextual Discovery
The mechanism: Contextual tours surface high-value features at the exact moment they're relevant. Show an advanced reporting tour when a user creates their fifth dashboard, not at signup when the context is irrelevant.
The timing matters more than the content. The same feature walkthrough that gets ignored at signup drives engagement when triggered by user behavior that signals readiness.
Traditional tour tools rely on linear "click Next to continue" patterns. Users click through without engaging. Completion rate looks good but feature adoption stays flat. Look for platforms that use interactive patterns—cursor guidance, progressive reveals, engagement mechanics that require actual interaction—to ensure users experience the feature instead of reading about it.
Business outcome: Jimo customer data shows up to 20-30% improvement in feature adoption rates because users discover differentiating capabilities during evaluation, not after they've formed an opinion of the product. This applies equally to new prospects evaluating features and existing users who haven't discovered high-value capabilities yet. Your results will depend on how well the contextual triggers match actual user readiness signals.
How to measure it: Track which tour steps correlate with feature adoption and with trial-to-paid conversion. Segment by tour engagement level and compare feature adoption rates for users who completed contextual feature tours versus those who didn't.
The platform should connect tour engagement to feature usage automatically. Manual event tracking between the tour system and your product analytics creates gaps.
7. Enable Personalized Stakeholder Journeys Without Building 5 Separate Tours
The mechanism: Audience targeting enables one tour link with multiple paths. Each stakeholder or user segment sees a flow optimized for their context. A CPO sees the ROI dashboard. An IT lead sees compliance and security features. A trial user from an enterprise account sees a different onboarding flow than an SMB user.
This applies to both internal alignment (CPO, CS lead, finance, IT) and post-sale activation (enterprise users versus SMB users versus trial users). The same targeting logic works across both contexts.
If creating segment-specific flows requires engineering support or manual duplication, you're creating maintenance overhead that increases total cost of ownership. The platform should let you define audience rules, which can include: role, plan, geography, lifecycle stage, and more, and dynamically serve the right path.
Most platforms stop here: they let you build separate paths manually. The question is whether the platform helps you create those variations. Recording your flow once and having variations generated automatically cuts weeks off initial setup and eliminates version drift when you update content.
Business outcome: Activation rates become consistent across segments because each user sees a tour matched to their context rather than a one-size-fits-all walkthrough. Product Ops teams stop maintaining five separate tour flows and manage everything from a single source.
How to measure it: Track activation rate by segment (role, plan, geography) and compare tour completion rates across segments. Identify which stakeholder personas or user types have the highest drop-off and adjust tour paths accordingly.
How to Present These Findings to Your CFO and CPO
You have the data. Now you need to package it for a budget meeting. Here's how to frame the investment so it survives finance scrutiny.
The One-Slide ROI Summary
Your CFO has five minutes. Lead with dollars, not features.
Slide structure:
Investment: Platform cost + implementation time
Revenue impact: Trial-to-paid conversion lift × ACV × trial volume = $X additional ARR
Cost savings: CS hours deflected × fully-loaded hourly rate × monthly volume = $Y annual savings
Payback period: Investment ÷ (monthly revenue impact + monthly cost savings) = Z months
Net impact Year 1: (Revenue impact + cost savings) - investment = $ABC net gain
Example:
Investment: $10K annual platform cost + 40 PM hours (implementation) = ~$15K total Year 1 cost
Revenue impact: 15% trial conversion lift × $12K ACV × 500 monthly trials = $900K additional ARR annually
Cost savings: 2.4 CS hours saved per account × $85/hour × 120 monthly accounts = $294K annual savings
Payback period: $15K ÷ ($75K monthly revenue impact + $24.5K monthly savings) = 0.15 months
Net impact Year 1: $1.194M - $15K = $1.179M net gain
This is the format that gets approved. Revenue impact and cost savings in the same calculation. Payback period under two months.
How to Handle "Why Not Build This In-House?"
Your CFO will ask this. Have the answer ready.
Time-to-value comparison: "Building this in-house requires 3-4 months of frontend engineering time. At our engineering hourly rate, that's $80K-$120K in development cost plus 3-4 months of opportunity cost during which our activation problem continues. A platform solution deploys in 2 weeks and starts generating data immediately. The opportunity cost of waiting 4 months at our current churn rate is $X in lost ARR."
Ongoing maintenance: "In-house builds require ongoing maintenance every time we ship a product update. Our product team ships 6-8 major releases per quarter. That's 24-32 tour updates per year, requiring engineering time for each. Platform solutions adapt automatically to UI changes through behavioral selectors. The maintenance cost delta is 40-60 engineering hours annually, or $12K-$18K in avoided engineering cost."
Feature velocity: "Platforms invest in capabilities we'd never justify building ourselves: AI-powered tour generation, analytics integration, segmentation logic, A/B testing infrastructure. To match feature parity, we'd need 6-9 months of dedicated engineering. The platform gives us these capabilities day one."
Risk: "In-house builds depend on specific team members who understand the codebase. If they leave, knowledge walks out the door. Platform vendors provide documentation, support, and ongoing feature development that doesn't depend on internal tribal knowledge."
This isn't about features. It's about opportunity cost and total cost of ownership. Frame the in-house option as the expensive, risky choice.
Creating Urgency: What We Lose By Waiting
CFOs delay decisions when there's no visible cost to waiting. Show them what delay costs.
Monthly churn calculation: "Our activation rate is currently 40%. We're churning 60% of trials every month. At 500 trials per month, that's 300 users who never activate. If we could move 30% of those to activation (15% lift), that's 90 additional paying customers per month. Every month we wait to implement tours costs us 90 customers × $12K ACV = $1.08M in lost ARR opportunity."
Quarterly board metrics: "Our board measures us on activation rate and trial-to-paid conversion. Q1 numbers show 40% activation, 16% trial-to-paid. If we approve this in March and implement by mid-April, we'll have 10 weeks of data showing improvement before our Q2 board meeting. If we wait until Q2 to approve, we won't have proof of improvement until Q3, making it harder to justify additional growth investment."
Competitive pressure: "Our competitors are already using platforms like this. Their trial-to-paid conversion rates are 5-8 percentage points higher than ours according to industry benchmarks. Every quarter we operate with worse activation gives them compounding advantage in market share."
This shifts the conversation from "should we invest?" to "can we afford to wait?"
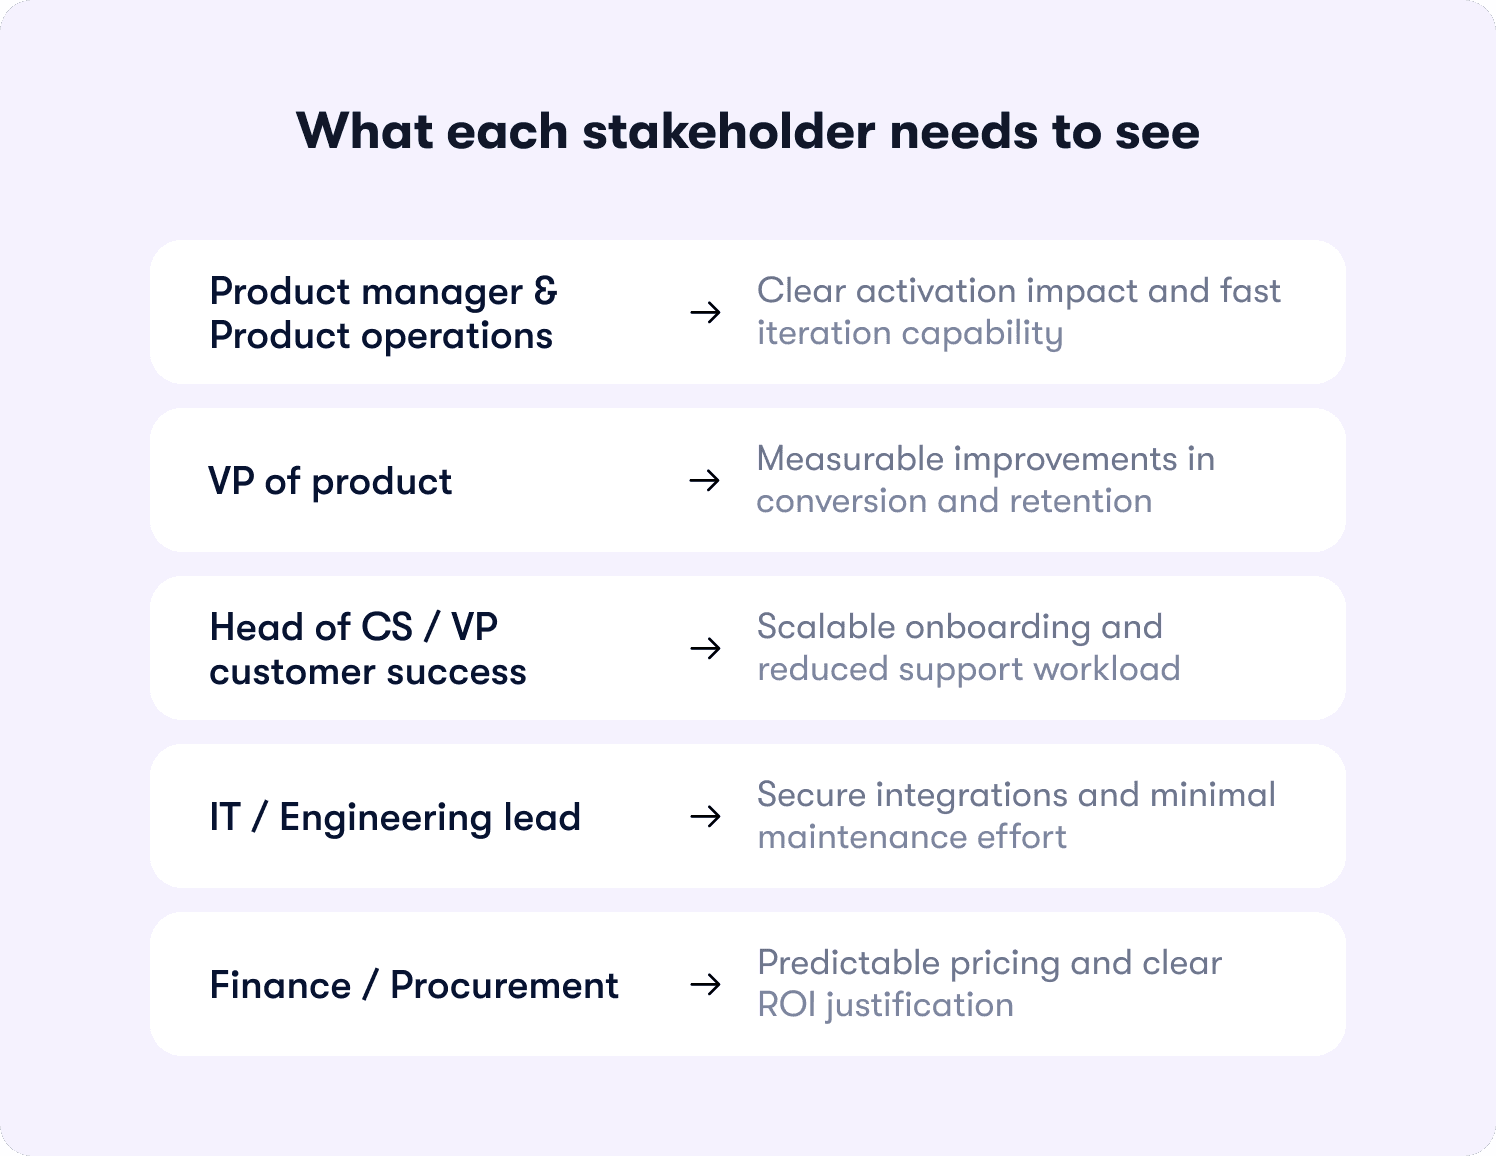
Internal Alignment Playbook: What Each Stakeholder Needs to See
You found the tool that fixes your activation problem. Now you need to convince four other people, each of whom cares about completely different things. This playbook shows you what each stakeholder needs to see in the tour and how to deliver it from a single shared link.
Product Manager and Product Operations
What you need: Product depth. Core workflows, feature richness, integration capabilities, and proof that the tool solves your specific activation or adoption challenge.
You're evaluating whether this platform can deliver on the outcomes you're measured on. Can it guide users to their first value moment? Does it adapt when user behavior changes? Can you iterate without queuing engineering sprints?
You need to see the mechanics. How do action-based tours work? How does audience targeting handle segment-specific flows? How does the platform connect tour engagement to activation metrics?
How Jimo delivers it: The core product tours experience shows you the full capability set. You see how tours auto-progress based on real user interactions, how onboarding checklists structure the activation path, how hints and tooltips provide contextual help, and how the resource center scales self-serve support.
VP of Product
Your VP of Product doesn't want feature lists. They want to know whether this moves the metrics they report to the board. Does it improve trial-to-paid conversion? Does it reduce time-to-first-value? Do customers who use this tool retain better?
They also need to see that this isn't a one-time project. Does the platform compound value over time, or does it require constant manual reconfiguration?
How Jimo delivers it: The tour surfaces customer stories with specific outcomes showing the retention and efficiency gains VPs care about. The tour also demonstrates how Jimo's AI learning loop means tours improve continuously as user behavior evolves, rather than requiring manual updates after every product release.
Head of CS / VP Customer Success
Your CS lead knows that every hour spent on basic onboarding calls is an hour not spent on expansion conversations. They need proof that tours handle the repetitive education load at scale—and specific numbers on labor cost savings they can use to justify headcount allocation.
They also need visibility into tour engagement. Which accounts completed onboarding? Which ones stalled at setup? Can CS prioritize outreach based on tour completion data?
How Jimo delivers it: The tour shows how onboarding process tools guide users through setup without CS involvement. It demonstrates how retention insights surface early churn signals based on tour engagement patterns.
The CS lead sees that Jimo doesn't just deflect support tickets—it gives CS teams the behavioral data they need to focus high-touch effort where it drives the most impact. Accounts that don't complete tours get proactive outreach. Accounts that complete advanced feature tours get expansion conversations.
IT / Engineering Lead
Your IT lead evaluates whether this platform creates technical debt. Does it require ongoing engineering work? How does it handle authentication? What data does it collect? How does it integrate with your existing stack?
They also need to know whether the platform meets security requirements. SOC2 certification, data masking, access controls, audit trails.
How Jimo delivers it: The tour surfaces technical documentation immediately. API specs, integration options, authentication flows, data handling policies. Your IT lead can evaluate the security model and integration architecture without booking a separate technical deep-dive call.
The critical detail for IT: engineering handles initial setup (authentication, event tracking, integrations), then product and GTM teams own all content updates. No ongoing engineering maintenance for tour iterations.
Finance / Procurement
Finance wants to know what this costs and whether the investment makes sense. Is pricing based on MAU (which creates budget risk as usage grows)? Are critical features locked behind enterprise tiers? What's the ROI calculation?
How Jimo delivers it: Jimo publishes transparent pricing with clearly defined MAU thresholds and no feature gating across tiers. Finance can forecast costs at 2x, 5x, or 10x projected growth without entering a custom quote cycle or worrying about hidden enterprise-only functionality. Pricing scales predictably with adoption, making it straightforward to model budget impact alongside projected activation and conversion improvements.
The ROI case is straightforward: tours reduce CS intervention (quantified in support ticket volume and labor hours), compress onboarding cycles (quantified in time-to-activation), and improve conversion rates (quantified in trial-to-paid lift). Finance can model the payback period based on current CS costs and activation metrics—typically under 2 months at standard trial volumes.
How to Evaluate Interactive Tour Platforms (And When Jimo Fits)
You've read the ROI framework. You understand the seven benefits. Now you need to know which platform capabilities actually deliver those outcomes—and which are table stakes that every vendor claims but few execute well.
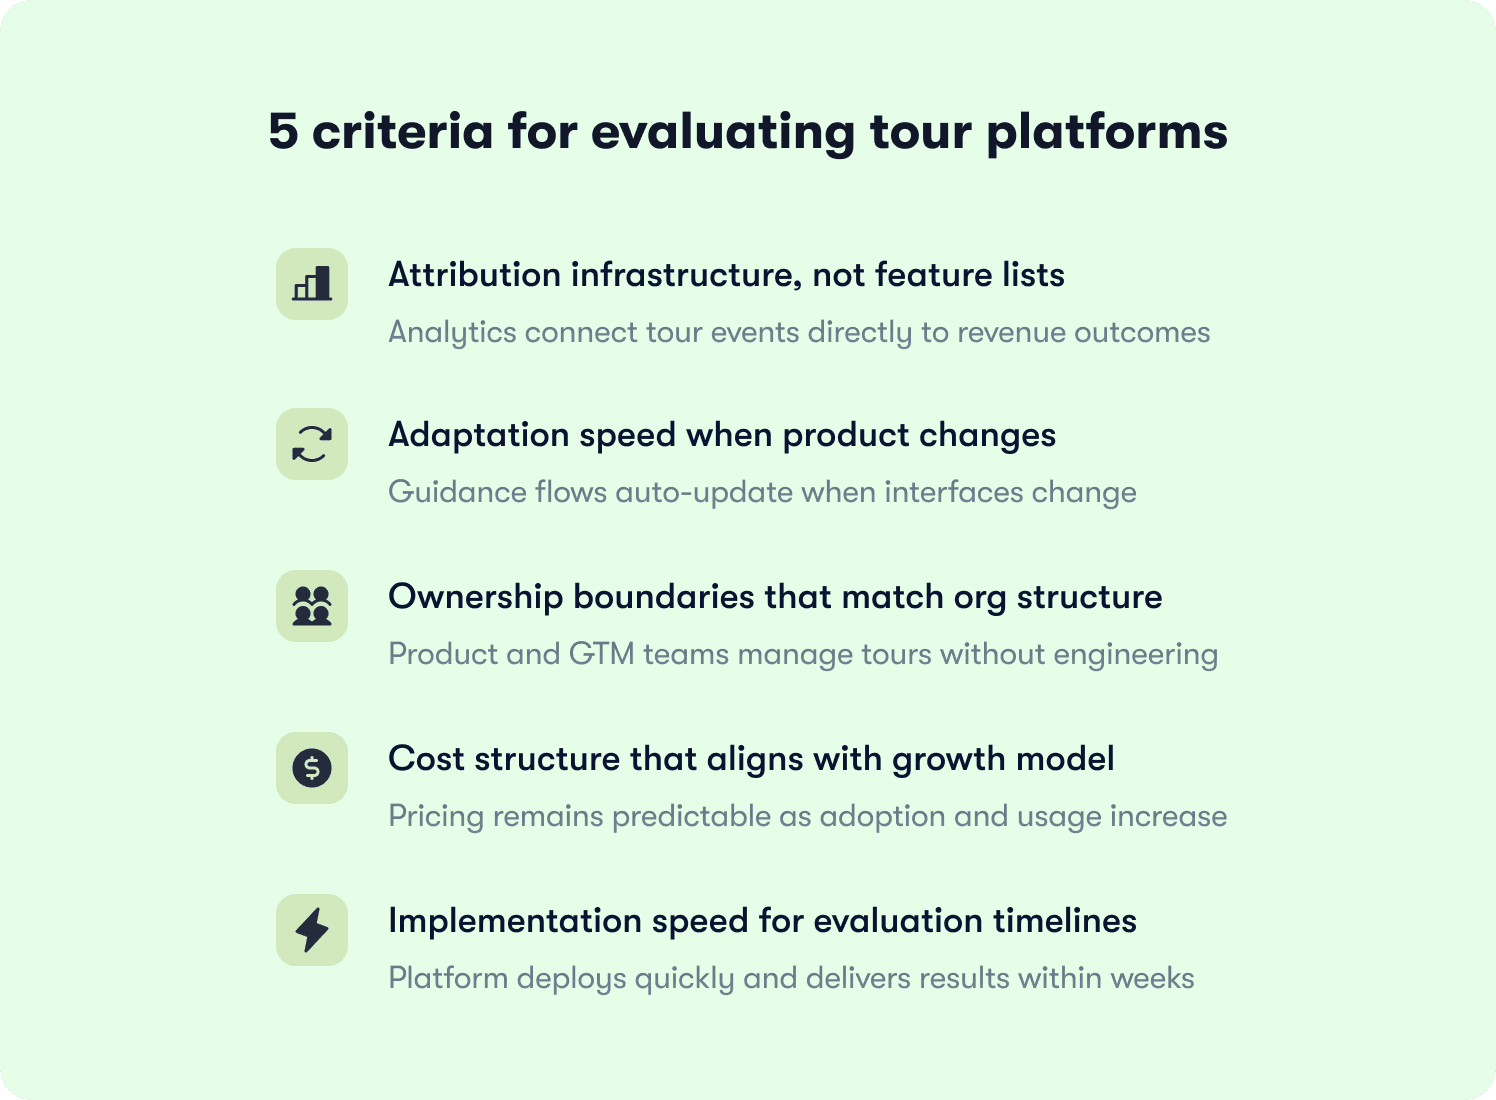
The gap between what platforms promise and what they deliver shows up in five areas: attribution infrastructure, adaptation speed, ownership boundaries, cost structure, and implementation timelines. These aren't feature comparisons. They're operational constraints that determine whether a platform moves your metrics or creates overhead.
Attribution infrastructure, not feature lists
Every platform claims "analytics." The question is whether those analytics connect tour interactions to revenue outcomes automatically, or whether you're exporting CSVs and building Looker dashboards manually. If proving ROI requires a data analyst, the platform has failed.
Look for native integrations that push tour events directly to your existing analytics stack. Jimo connects to Segment, Mixpanel, and major platforms without custom event mapping. The alternative—manually instrumenting every tour interaction, adds engineering dependency that defeats the purpose of a no-code platform.
Adaptation speed when your product changes
You ship a product update. Your tours now reference UI elements that don't exist. How fast can you fix this?
Static platforms require manual reconfiguration after every release. If your product team ships weekly, that's 50+ tour maintenance cycles annually. Look for platforms that use behavioral selectors and AI learning loops that adapt automatically when user patterns shift. This isn't a luxury feature—it's the difference between tours that compound value over time and tours that become technical debt.
Ownership boundaries that match your org structure
The wrong ownership model kills adoption. If engineering owns tour creation, PMs wait in sprint queues. If PMs own creation but can't customize design without CSS skills, tours look generic and off-brand.
The right model: engineering handles authentication, event tracking, and integrations once during setup. After that, product and GTM teams own everything—content, design, targeting, iteration. No code required, but full design control available. Jimo's builder works like Figma: drag, resize, style, position any element without CSS dependencies.
Cost structure that aligns with your growth model
MAU-based pricing penalizes success. Your activation improves, usage grows, and your vendor bill spikes. Look for pricing that scales with team size, not usage volume, or companies that proudly promote price transparency. This matters when presenting to finance—predictable costs eliminate budget risk as you scale.
Implementation speed that matches evaluation timelines
If you're trying to prove value in Q1 to justify Q2 budget, a 12-week implementation means you're showing results in Q3. Look for platforms that deploy in days, not quarters. Jimo's Chrome extension setup takes hours. The alternative—vendor-managed implementations requiring dedicated project managers—works for enterprises with 18-month buying cycles. It doesn't work when you need data by next board meeting.
When Jimo Matches Your Constraints (And When It Doesn't)
Jimo serves product teams at scaling B2B SaaS (150-500 people) where specific operational realities create pressure:
Your activation gap is measurable but engineering capacity is the blocker. Analytics show exactly where users drop off. Shipping fixes requires sprint cycles you don't have. If tour maintenance competes with feature development for engineering time, you need PM-owned iteration without code dependencies.
Your product velocity breaks static tours. You ship weekly. Tours built last month reference UI that changed yesterday. Manual reconfiguration eats PM time. If keeping tours current requires constant maintenance, you need platforms that adapt automatically as user behavior evolves.
Proving ROI requires connecting guidance to revenue, not just engagement. Your CFO won't approve based on "83% completion rate." You need attribution showing tour completers convert at 22% versus 16% for non-completers. If your current stack forces you to manually bridge tour data and activation data, you're adding a week of work to every business case update.
CS labor costs exceed platform costs by 10x. You're paying senior CS salaries ($85/hour fully-loaded) for repetitive onboarding calls that should be self-serve. Three hours per account across 120 monthly accounts is $30,600/month in CS labor. If self-serve tours can deflect 75% of that ($22,950/month saved), the platform pays for itself in two weeks.
Trade-offs to consider: If your product changes quarterly (not weekly), static platforms may suffice—the adaptation capability won't justify switching costs. If your organization mandates 6-month vendor reviews regardless of deployment speed, enterprise platforms with dedicated implementation teams may fit your process better. If your design system requires custom code for every UI component, in-house builds give you complete control.
But if speed matters, if PM capacity is constrained, and if you need to prove value by next quarter, Jimo's operational model reduces total cost of ownership by transferring tour ownership from engineering to the teams who iterate daily. Curious to see Jimo in action? Start your free trial today.
FAQs
How long does implementation take?
Jimo's Chrome extension deploys in hours. First tour launches within a week. Compare this to enterprise DAPs requiring 8-12 weeks of vendor-managed implementation. If you're trying to prove value in Q1 to justify Q2 budget, deployment speed determines whether you have data for your next board meeting.
Can we use this with our existing analytics stack?
Yes. Jimo integrates natively with Segment, Mixpanel, Amplitude, and pushes events to custom data warehouses. If you're using Jimo's Success Tracker, no separate analytics setup is required. The platform connects tour completion to activation milestones automatically without manual event mapping.
What happens if our product UI changes frequently?
Where Jimo excels is it uses behavioral selectors and AI learning loops that adapt automatically when user patterns shift. You're not manually updating tours after every product release. If your product team ships weekly, this eliminates 50+ tour maintenance cycles annually—the difference between tours that compound value and tours that become technical debt.
Can we A/B test different tour variations with Jimo?
Yes. Jimo supports A/B testing at the tour level, letting you compare completion rates and activation conversion across different approaches. This matters for iteration—you can test whether action-based tours drive higher conversion than linear tours, or whether contextual triggers outperform broadcast timing, without building custom experimentation infrastructure.
TL;DR
Getting budget approval for adoption platforms requires proving ROI to multiple stakeholders—your CPO needs retention data, CS needs ticket deflection proof, finance needs payback calculations. This article gives you the measurement framework to connect tours to revenue outcomes, the 7 benefits to quantify in your business case, and the stakeholder playbook to compress alignment cycles by 20-30%.
You're a PM at a 200-person SaaS trying to get budget approval for an adoption platform. Tool evaluation isn't your current problem. It's internal alignment.
Your Head of Product won't sign off without retention data. Your Customer Success lead needs ticket deflection proof. Finance wants a payback period calculation. Engineering wants to know this won't create technical debt.
By the time you realize it, you've burned a week between each thread of conversation and calendar syncs. Four stakeholders, four separate meetings to show the same platform from four angles. Two weeks stretches into six. Your activation numbers keep sliding while you play calendar Tetris.
Interactive product tours solve both problems. They compress internal approval cycles (20-30% faster stakeholder alignment), accelerate user activation cycles (up to 40% reduction in time-to-first-value), and speed product iteration cycles (from 3-month dev queues to same-week launches). This article gives you the ROI framework to quantify each acceleration and the presentation templates to justify the investment.
Why Proving Interactive Tour ROI Is Harder Than It Should Be
Most tour platforms give you vanity metrics. 83% completion rate. 2,000 tour views. 4.2 average steps completed. None of this answers the question your CFO will ask: "Did the users who completed tours convert to paid accounts at higher rates?"
The measurement gap exists because tour platforms treat guidance as isolated from business outcomes. The platform you choose needs to close this attribution gap automatically. If you're manually instrumenting events, exporting CSVs, and building dashboards to prove tour impact, you've added a week of work to every business case update.
ROI Measurement Framework: Connect Tour Engagement to Revenue Outcomes
Leadership breathes concrete numbers, which means you need to know whether your users activated, retained, or converted to paid. Use this framework below to connect your tour engagement to metrics that actually justify investment.
Step 1: Define tour events that predict conversion
Tour start and tour completion are vanity metrics. They tell you someone saw your guidance and clicked through. However, they don't tell you whether they activated.
The events that predict conversion are high-intent actions:
Viewed pricing section
Invited a teammate
Connected an integration
Completed setup checklist
Created their first project or dashboard
Explored advanced feature documentation
Known as behavioral signals, users who complete these steps during a tour are signaling purchase intent or activation readiness. Track these as distinct events, not as a single "tour completed" metric.
Step 2: Establish baseline metrics before implementation
You need a before state to measure against. Track these metrics for at least two weeks before launching tours:
Activation rate (percentage of signups who reach your activation milestone)
Trial-to-paid conversion rate
Time-to-first-value (median days from signup to activation)
CS ticket volume per new account
CS hours spent on manual onboarding per account
30-day retention rate
Without baselines, you're guessing whether tours moved metrics or whether natural variance explains the change. Your CFO will ask for baselines. Have them ready.
Step 3: Connect tour events to your analytics stack
Tour data needs to flow into the same system where you track activation and retention. If tour events live in one platform and product usage lives in another, you're manually bridging the gap every time you want to prove impact.
Jimo pushes events natively to Segment, Mixpanel, or your own data warehouse. If you're using Jimo's built-in Success Tracker, no additional setup is required. The platform connects tour completion to activation milestones automatically.
If your analytics stack doesn't support native integrations, you're adding technical dependency that slows iteration. Every new tour requires engineering work to instrument events. This matters when you're trying to iterate based on what's working—waiting two weeks for event tracking means you can't optimize during the evaluation window.
Step 4: Segment users by tour engagement level
After tours have been live for at least 30 days, segment users into cohorts:
Completed tour: Finished all steps and required actions
Partial completion: Started but dropped off
No engagement: Never saw or dismissed the tour
Compare baseline metrics across these segments. If users who completed tours activated at 45% versus 40% for non-completers, that's a 12.5% lift.
Step 5: Calculate cost savings and revenue impact
Present results with both percentage lift and dollar impact. Your CFO thinks in dollars, not percentages. See the "How to Present These Findings to Your CFO" section below for complete calculation templates and presentation format.
Step 6: Event taxonomy that makes attribution obvious
Your event naming should make it easy to trace user journeys from tour engagement to activation to revenue. Use this structure:
tour_started- User saw the tourtour_completed- User finished all stepstour_step_completed: invite_teammate- User completed specific actiontour_step_completed: view_pricing- User viewed pricingtour_step_completed: connect_integration- User connected integrationtour_step_completed: complete_setup- User finished setup checkliststakeholder_share- User shared tour with internal stakeholder
Each event should include metadata: user ID, timestamp, tour ID, step ID, account tier. This lets you segment by plan type when presenting to finance.
To simplify these processes, Jimo's Success Tracker captures these events and connects them to activation milestones via no-code event tagging so PMs don't need to involve engineering to close the attribution loop.
7 Measurable Benefits That Justify Interactive Tour Investment
These benefits are ordered by what gets budget approved: revenue impact first, cost savings second, efficiency gains third. Each includes the mechanism (how it works), the business outcome (what it delivers), and the measurement approach (how to quantify it for your CFO).
1. Prove ROI with Attribution Models That Connect Tours to Revenue
The mechanism: Tour engagement events (start, key-step completion, high-intent actions like "invited teammate" or "viewed pricing") get captured and connected to downstream activation and retention metrics.
The platform should handle this connection via no-code event tagging. If you're manually instrumenting events and pushing them to Segment or Mixpanel, you've added technical dependency that slows iteration and makes it harder to prove ROI during the evaluation period.
Product and GTM leaders can show a clear attribution path: "Users who completed the tour's invite-teammate step had 2.3x higher activation rates and 40% faster time-to-paid conversion." This is the difference between reporting tour views and proving business impact.
Business outcome: PMs and CPOs can prove interactive tour ROI to leadership with attribution that connects guidance interactions to activation, retention, and expansion outcomes—not just tour completion percentages.
This is the proof point you show in budget discussions. Vanity metrics (83% completion rate) don't justify investment. Attribution to conversion and retention does.
How to measure it: Define key tour events (start, key-step completion, high-intent actions) and connect them to your activation and retention tracking. Track time-to-first-value, activation rate, and trial-to-paid conversion for users who completed tours versus those who didn't, segmented by plan or account type.
The platform should push these events to your analytics stack natively. For example, Jimo integrates with Segment, Mixpanel, and major analytics platforms through integrations, or you can use the built-in Success Tracker if you don't want to maintain separate analytics infrastructure for actionable reports.
2. Improve Trial-to-Paid Conversion with Action-Based Guidance
The mechanism: Action-based tours auto-progress based on real user interactions—clicks, page conditions, form inputs—rather than passive "Next" button taps. Users complete the actual activation behavior (create a dashboard, invite a teammate, set up an integration), not just the tour.
Most tour platforms let users click through without doing anything. Completion rate looks good but activation stays flat. Tours that require real interaction force the behavior that drives conversion.
The platform should adapt these flows automatically when user behavior changes. Manual reconfiguration after each release kills momentum—and makes it impossible to iterate during a trial period when you're trying to prove value quickly.
Business outcome: Jimo customer data shows up to 15-25% improvement in trial-to-paid conversion because tours guide users to their first success event rather than explaining features. Your results will depend on how well the tour maps to your actual activation event.
Florian Labadens, SVP Product at Zenchef, put the stakes clearly: "We know that if onboarding takes more than 30 days, we are twice as likely to lose that customer within six months." Using product tours and onboarding checklists, Zenchef compressed onboarding from 30 days to 14 days—every day shaved off directly prevented churn. Read Zenchef's journey with Jimo.
How to measure it: Track activation rate (users who completed the tour's key activation step) against trial-to-paid conversion rate. Segment by tour completion versus non-completion to isolate impact.
The platform should connect tour completion events directly to activation milestones without manual CRM mapping. If you're manually tagging events and pushing them to your analytics stack, you've added friction that slows iteration.
3. Reduce CS Intervention and Support Tickets with Scalable Product Education
The mechanism: Interactive tours handle repetitive product education—basic feature walkthroughs, integration overviews, account setup flows—so CS teams don't cover the same ground on onboarding calls.
The scalability piece matters when justifying cost. If launching and iterating tours requires engineering sprints, product education doesn't scale without adding CS headcount. The platform should let GTM teams deploy and adjust tours without technical dependencies using onboarding process tools that don't require code.
This frees CS capacity for high-value conversations: expansion discussions, strategic account reviews, proactive churn prevention. CS stops being the onboarding bottleneck and becomes a growth driver.
Business outcome: Jimo customer data shows up to 40% reduction in CS intervention and support tickets because users resolve common questions through self-serve tours before they raise a ticket or request a call.
How to measure it: Track support ticket volume per account before and after tour implementation. Segment by tour completion rate and compare CS hours required for accounts where users completed tours versus those who didn't.
Connect tour engagement to early churn signals. Users who don't complete onboarding tours are often the same accounts that churn at 30-60 days. Jimo's retention insights surface these patterns automatically.
4. Reduce Internal Alignment Time Through Async Stakeholder Education
The mechanism: Instead of scheduling separate walkthroughs to explain the same product to a CPO, a CS lead, and a finance approver, a champion shares a single tour link. Each stakeholder sees a personalized path based on their role. CPO sees ROI proof. CS lead sees onboarding depth. Finance sees pricing clarity.
This works for both external sales cycles and internal approval processes. The friction is identical whether you're convincing a prospect's buying committee or your own leadership team.
The platform should create these separate paths from one tour link without engineering support. If you're building five separate tours for five stakeholders, version control becomes a nightmare.
Business outcome: Jimo customer data shows up to 20-30% compression in internal alignment cycles because stakeholder education happens in parallel, not sequentially. Weeks of calendar coordination get replaced by a single async touchpoint. Your results will vary by deal complexity and stakeholder count.
How to measure it: Track time from champion signup to internal approval decision for leads who used a shared tour link versus those who went through sequential demo calls. Segment by deal size.
Track which stakeholder personas complete which tour steps. Correlate completion with stage progression. Did the stakeholders who viewed pricing advocate for budget approval? Did accounts where multiple stakeholders engaged move faster?
5. Accelerate Self-Serve Discovery and Reduce Time-to-Activation
The mechanism: Interactive tours let users explore the product on their own timeline, surfacing features relevant to their role and use case without requiring a live demo.
The key differentiator is behavioral triggering. Tours that fire generically at signup get ignored. Tours that surface at the exact moment users are ready to act—showing an integration tour when a user creates their third dashboard, for example—arrive when context makes them relevant.
This self-serve exploration does two things that matter for justifying investment. Users reach their first value moment faster because they're not waiting for scheduled demos. Product teams can prioritize follow-up for users who completed high-intent tour steps (viewed pricing, explored integrations, invited teammates) rather than treating all signups equally.
Business outcome: Time-to-activation can accelerate by up to 30-40% because users aren't blocked by demo scheduling and they're guided directly to activation behaviors that matter. The upper end of this range comes from products with clear activation moments and well-defined behavioral triggers.
Morgane Ruaud, Product Design Team Lead at AB Tasty, described the before state: her team waited over three months for engineering resources to launch feature communications. After implementing Jimo, their launch cycle compressed to 2 weeks. The first campaign launched in 90 minutes and reached 2,000 users in week one. Read AB Tasty's journey with Jimo.
How to measure it: Track tour engagement events (start, key-step completion, high-intent actions) and correlate with activation rate and trial-to-paid conversion. Segment by tour engagement level to identify which steps signal strongest purchase intent.
The platform should surface these patterns automatically using behavior metrics. If you're manually running cohort analysis to figure out which tour steps predict conversion, you're spending time on reporting instead of iteration.
6. Increase Feature Adoption Rates with Contextual Discovery
The mechanism: Contextual tours surface high-value features at the exact moment they're relevant. Show an advanced reporting tour when a user creates their fifth dashboard, not at signup when the context is irrelevant.
The timing matters more than the content. The same feature walkthrough that gets ignored at signup drives engagement when triggered by user behavior that signals readiness.
Traditional tour tools rely on linear "click Next to continue" patterns. Users click through without engaging. Completion rate looks good but feature adoption stays flat. Look for platforms that use interactive patterns—cursor guidance, progressive reveals, engagement mechanics that require actual interaction—to ensure users experience the feature instead of reading about it.
Business outcome: Jimo customer data shows up to 20-30% improvement in feature adoption rates because users discover differentiating capabilities during evaluation, not after they've formed an opinion of the product. This applies equally to new prospects evaluating features and existing users who haven't discovered high-value capabilities yet. Your results will depend on how well the contextual triggers match actual user readiness signals.
How to measure it: Track which tour steps correlate with feature adoption and with trial-to-paid conversion. Segment by tour engagement level and compare feature adoption rates for users who completed contextual feature tours versus those who didn't.
The platform should connect tour engagement to feature usage automatically. Manual event tracking between the tour system and your product analytics creates gaps.
7. Enable Personalized Stakeholder Journeys Without Building 5 Separate Tours
The mechanism: Audience targeting enables one tour link with multiple paths. Each stakeholder or user segment sees a flow optimized for their context. A CPO sees the ROI dashboard. An IT lead sees compliance and security features. A trial user from an enterprise account sees a different onboarding flow than an SMB user.
This applies to both internal alignment (CPO, CS lead, finance, IT) and post-sale activation (enterprise users versus SMB users versus trial users). The same targeting logic works across both contexts.
If creating segment-specific flows requires engineering support or manual duplication, you're creating maintenance overhead that increases total cost of ownership. The platform should let you define audience rules, which can include: role, plan, geography, lifecycle stage, and more, and dynamically serve the right path.
Most platforms stop here: they let you build separate paths manually. The question is whether the platform helps you create those variations. Recording your flow once and having variations generated automatically cuts weeks off initial setup and eliminates version drift when you update content.
Business outcome: Activation rates become consistent across segments because each user sees a tour matched to their context rather than a one-size-fits-all walkthrough. Product Ops teams stop maintaining five separate tour flows and manage everything from a single source.
How to measure it: Track activation rate by segment (role, plan, geography) and compare tour completion rates across segments. Identify which stakeholder personas or user types have the highest drop-off and adjust tour paths accordingly.
How to Present These Findings to Your CFO and CPO
You have the data. Now you need to package it for a budget meeting. Here's how to frame the investment so it survives finance scrutiny.
The One-Slide ROI Summary
Your CFO has five minutes. Lead with dollars, not features.
Slide structure:
Investment: Platform cost + implementation time
Revenue impact: Trial-to-paid conversion lift × ACV × trial volume = $X additional ARR
Cost savings: CS hours deflected × fully-loaded hourly rate × monthly volume = $Y annual savings
Payback period: Investment ÷ (monthly revenue impact + monthly cost savings) = Z months
Net impact Year 1: (Revenue impact + cost savings) - investment = $ABC net gain
Example:
Investment: $10K annual platform cost + 40 PM hours (implementation) = ~$15K total Year 1 cost
Revenue impact: 15% trial conversion lift × $12K ACV × 500 monthly trials = $900K additional ARR annually
Cost savings: 2.4 CS hours saved per account × $85/hour × 120 monthly accounts = $294K annual savings
Payback period: $15K ÷ ($75K monthly revenue impact + $24.5K monthly savings) = 0.15 months
Net impact Year 1: $1.194M - $15K = $1.179M net gain
This is the format that gets approved. Revenue impact and cost savings in the same calculation. Payback period under two months.
How to Handle "Why Not Build This In-House?"
Your CFO will ask this. Have the answer ready.
Time-to-value comparison: "Building this in-house requires 3-4 months of frontend engineering time. At our engineering hourly rate, that's $80K-$120K in development cost plus 3-4 months of opportunity cost during which our activation problem continues. A platform solution deploys in 2 weeks and starts generating data immediately. The opportunity cost of waiting 4 months at our current churn rate is $X in lost ARR."
Ongoing maintenance: "In-house builds require ongoing maintenance every time we ship a product update. Our product team ships 6-8 major releases per quarter. That's 24-32 tour updates per year, requiring engineering time for each. Platform solutions adapt automatically to UI changes through behavioral selectors. The maintenance cost delta is 40-60 engineering hours annually, or $12K-$18K in avoided engineering cost."
Feature velocity: "Platforms invest in capabilities we'd never justify building ourselves: AI-powered tour generation, analytics integration, segmentation logic, A/B testing infrastructure. To match feature parity, we'd need 6-9 months of dedicated engineering. The platform gives us these capabilities day one."
Risk: "In-house builds depend on specific team members who understand the codebase. If they leave, knowledge walks out the door. Platform vendors provide documentation, support, and ongoing feature development that doesn't depend on internal tribal knowledge."
This isn't about features. It's about opportunity cost and total cost of ownership. Frame the in-house option as the expensive, risky choice.
Creating Urgency: What We Lose By Waiting
CFOs delay decisions when there's no visible cost to waiting. Show them what delay costs.
Monthly churn calculation: "Our activation rate is currently 40%. We're churning 60% of trials every month. At 500 trials per month, that's 300 users who never activate. If we could move 30% of those to activation (15% lift), that's 90 additional paying customers per month. Every month we wait to implement tours costs us 90 customers × $12K ACV = $1.08M in lost ARR opportunity."
Quarterly board metrics: "Our board measures us on activation rate and trial-to-paid conversion. Q1 numbers show 40% activation, 16% trial-to-paid. If we approve this in March and implement by mid-April, we'll have 10 weeks of data showing improvement before our Q2 board meeting. If we wait until Q2 to approve, we won't have proof of improvement until Q3, making it harder to justify additional growth investment."
Competitive pressure: "Our competitors are already using platforms like this. Their trial-to-paid conversion rates are 5-8 percentage points higher than ours according to industry benchmarks. Every quarter we operate with worse activation gives them compounding advantage in market share."
This shifts the conversation from "should we invest?" to "can we afford to wait?"
Internal Alignment Playbook: What Each Stakeholder Needs to See
You found the tool that fixes your activation problem. Now you need to convince four other people, each of whom cares about completely different things. This playbook shows you what each stakeholder needs to see in the tour and how to deliver it from a single shared link.
Product Manager and Product Operations
What you need: Product depth. Core workflows, feature richness, integration capabilities, and proof that the tool solves your specific activation or adoption challenge.
You're evaluating whether this platform can deliver on the outcomes you're measured on. Can it guide users to their first value moment? Does it adapt when user behavior changes? Can you iterate without queuing engineering sprints?
You need to see the mechanics. How do action-based tours work? How does audience targeting handle segment-specific flows? How does the platform connect tour engagement to activation metrics?
How Jimo delivers it: The core product tours experience shows you the full capability set. You see how tours auto-progress based on real user interactions, how onboarding checklists structure the activation path, how hints and tooltips provide contextual help, and how the resource center scales self-serve support.
VP of Product
Your VP of Product doesn't want feature lists. They want to know whether this moves the metrics they report to the board. Does it improve trial-to-paid conversion? Does it reduce time-to-first-value? Do customers who use this tool retain better?
They also need to see that this isn't a one-time project. Does the platform compound value over time, or does it require constant manual reconfiguration?
How Jimo delivers it: The tour surfaces customer stories with specific outcomes showing the retention and efficiency gains VPs care about. The tour also demonstrates how Jimo's AI learning loop means tours improve continuously as user behavior evolves, rather than requiring manual updates after every product release.
Head of CS / VP Customer Success
Your CS lead knows that every hour spent on basic onboarding calls is an hour not spent on expansion conversations. They need proof that tours handle the repetitive education load at scale—and specific numbers on labor cost savings they can use to justify headcount allocation.
They also need visibility into tour engagement. Which accounts completed onboarding? Which ones stalled at setup? Can CS prioritize outreach based on tour completion data?
How Jimo delivers it: The tour shows how onboarding process tools guide users through setup without CS involvement. It demonstrates how retention insights surface early churn signals based on tour engagement patterns.
The CS lead sees that Jimo doesn't just deflect support tickets—it gives CS teams the behavioral data they need to focus high-touch effort where it drives the most impact. Accounts that don't complete tours get proactive outreach. Accounts that complete advanced feature tours get expansion conversations.
IT / Engineering Lead
Your IT lead evaluates whether this platform creates technical debt. Does it require ongoing engineering work? How does it handle authentication? What data does it collect? How does it integrate with your existing stack?
They also need to know whether the platform meets security requirements. SOC2 certification, data masking, access controls, audit trails.
How Jimo delivers it: The tour surfaces technical documentation immediately. API specs, integration options, authentication flows, data handling policies. Your IT lead can evaluate the security model and integration architecture without booking a separate technical deep-dive call.
The critical detail for IT: engineering handles initial setup (authentication, event tracking, integrations), then product and GTM teams own all content updates. No ongoing engineering maintenance for tour iterations.
Finance / Procurement
Finance wants to know what this costs and whether the investment makes sense. Is pricing based on MAU (which creates budget risk as usage grows)? Are critical features locked behind enterprise tiers? What's the ROI calculation?
How Jimo delivers it: Jimo publishes transparent pricing with clearly defined MAU thresholds and no feature gating across tiers. Finance can forecast costs at 2x, 5x, or 10x projected growth without entering a custom quote cycle or worrying about hidden enterprise-only functionality. Pricing scales predictably with adoption, making it straightforward to model budget impact alongside projected activation and conversion improvements.
The ROI case is straightforward: tours reduce CS intervention (quantified in support ticket volume and labor hours), compress onboarding cycles (quantified in time-to-activation), and improve conversion rates (quantified in trial-to-paid lift). Finance can model the payback period based on current CS costs and activation metrics—typically under 2 months at standard trial volumes.
How to Evaluate Interactive Tour Platforms (And When Jimo Fits)
You've read the ROI framework. You understand the seven benefits. Now you need to know which platform capabilities actually deliver those outcomes—and which are table stakes that every vendor claims but few execute well.
The gap between what platforms promise and what they deliver shows up in five areas: attribution infrastructure, adaptation speed, ownership boundaries, cost structure, and implementation timelines. These aren't feature comparisons. They're operational constraints that determine whether a platform moves your metrics or creates overhead.
Attribution infrastructure, not feature lists
Every platform claims "analytics." The question is whether those analytics connect tour interactions to revenue outcomes automatically, or whether you're exporting CSVs and building Looker dashboards manually. If proving ROI requires a data analyst, the platform has failed.
Look for native integrations that push tour events directly to your existing analytics stack. Jimo connects to Segment, Mixpanel, and major platforms without custom event mapping. The alternative—manually instrumenting every tour interaction, adds engineering dependency that defeats the purpose of a no-code platform.
Adaptation speed when your product changes
You ship a product update. Your tours now reference UI elements that don't exist. How fast can you fix this?
Static platforms require manual reconfiguration after every release. If your product team ships weekly, that's 50+ tour maintenance cycles annually. Look for platforms that use behavioral selectors and AI learning loops that adapt automatically when user patterns shift. This isn't a luxury feature—it's the difference between tours that compound value over time and tours that become technical debt.
Ownership boundaries that match your org structure
The wrong ownership model kills adoption. If engineering owns tour creation, PMs wait in sprint queues. If PMs own creation but can't customize design without CSS skills, tours look generic and off-brand.
The right model: engineering handles authentication, event tracking, and integrations once during setup. After that, product and GTM teams own everything—content, design, targeting, iteration. No code required, but full design control available. Jimo's builder works like Figma: drag, resize, style, position any element without CSS dependencies.
Cost structure that aligns with your growth model
MAU-based pricing penalizes success. Your activation improves, usage grows, and your vendor bill spikes. Look for pricing that scales with team size, not usage volume, or companies that proudly promote price transparency. This matters when presenting to finance—predictable costs eliminate budget risk as you scale.
Implementation speed that matches evaluation timelines
If you're trying to prove value in Q1 to justify Q2 budget, a 12-week implementation means you're showing results in Q3. Look for platforms that deploy in days, not quarters. Jimo's Chrome extension setup takes hours. The alternative—vendor-managed implementations requiring dedicated project managers—works for enterprises with 18-month buying cycles. It doesn't work when you need data by next board meeting.
When Jimo Matches Your Constraints (And When It Doesn't)
Jimo serves product teams at scaling B2B SaaS (150-500 people) where specific operational realities create pressure:
Your activation gap is measurable but engineering capacity is the blocker. Analytics show exactly where users drop off. Shipping fixes requires sprint cycles you don't have. If tour maintenance competes with feature development for engineering time, you need PM-owned iteration without code dependencies.
Your product velocity breaks static tours. You ship weekly. Tours built last month reference UI that changed yesterday. Manual reconfiguration eats PM time. If keeping tours current requires constant maintenance, you need platforms that adapt automatically as user behavior evolves.
Proving ROI requires connecting guidance to revenue, not just engagement. Your CFO won't approve based on "83% completion rate." You need attribution showing tour completers convert at 22% versus 16% for non-completers. If your current stack forces you to manually bridge tour data and activation data, you're adding a week of work to every business case update.
CS labor costs exceed platform costs by 10x. You're paying senior CS salaries ($85/hour fully-loaded) for repetitive onboarding calls that should be self-serve. Three hours per account across 120 monthly accounts is $30,600/month in CS labor. If self-serve tours can deflect 75% of that ($22,950/month saved), the platform pays for itself in two weeks.
Trade-offs to consider: If your product changes quarterly (not weekly), static platforms may suffice—the adaptation capability won't justify switching costs. If your organization mandates 6-month vendor reviews regardless of deployment speed, enterprise platforms with dedicated implementation teams may fit your process better. If your design system requires custom code for every UI component, in-house builds give you complete control.
But if speed matters, if PM capacity is constrained, and if you need to prove value by next quarter, Jimo's operational model reduces total cost of ownership by transferring tour ownership from engineering to the teams who iterate daily. Curious to see Jimo in action? Start your free trial today.
FAQs
How long does implementation take?
Jimo's Chrome extension deploys in hours. First tour launches within a week. Compare this to enterprise DAPs requiring 8-12 weeks of vendor-managed implementation. If you're trying to prove value in Q1 to justify Q2 budget, deployment speed determines whether you have data for your next board meeting.
Can we use this with our existing analytics stack?
Yes. Jimo integrates natively with Segment, Mixpanel, Amplitude, and pushes events to custom data warehouses. If you're using Jimo's Success Tracker, no separate analytics setup is required. The platform connects tour completion to activation milestones automatically without manual event mapping.
What happens if our product UI changes frequently?
Where Jimo excels is it uses behavioral selectors and AI learning loops that adapt automatically when user patterns shift. You're not manually updating tours after every product release. If your product team ships weekly, this eliminates 50+ tour maintenance cycles annually—the difference between tours that compound value and tours that become technical debt.
Can we A/B test different tour variations with Jimo?
Yes. Jimo supports A/B testing at the tour level, letting you compare completion rates and activation conversion across different approaches. This matters for iteration—you can test whether action-based tours drive higher conversion than linear tours, or whether contextual triggers outperform broadcast timing, without building custom experimentation infrastructure.


Level-up your onboarding in 30 mins
Discover how you can transform your product with experts from Jimo in 30 mins

Level-up your onboarding in 30 mins
Discover how you can transform your product with experts from Jimo in 30 mins
Level-up your onboarding in 30 mins
Discover how you can transform your product with experts from Jimo in 30 mins
Level-up your onboarding in 30 mins
Discover how you can transform your product with experts from Jimo in 30 mins
Keep Reading

SaaS
10 Best In-App Feedback Tools for SaaS Product Teams in 2026

Fahmi Dani
Product Designer @Jimo

SaaS
5 Best Product Intelligence Platforms for SaaS in 2026
Fahmi Dani
Product Designer @Jimo

SaaS
SaaS Customer Onboarding Templates for in-Product Flows: A Product Ops Guide for 2026

Thomas Moussafer
Co-Founder @Jimo
SaaS
10 Best In-App Feedback Tools for SaaS Product Teams in 2026
Fahmi Dani
Product Designer @Jimo
SaaS
5 Best Product Intelligence Platforms for SaaS in 2026
Fahmi Dani
Product Designer @Jimo
SaaS
SaaS Customer Onboarding Templates for in-Product Flows: A Product Ops Guide for 2026
Thomas Moussafer
Co-Founder @Jimo

SaaS
9 Best Product Usage Analytics Software for SaaS in 2026
Fahmi Dani
Product Designer @Jimo