TL;DR
Here's how to calculate NPS: subtract your percentage of detractors from your percentage of promoters. However, what trips teams up isn't the math, it's everything around it: mixed scales, small samples, blended segments, and a score that sits in a dashboard instead of triggering anything. This piece covers the calculation mistakes that quietly produce an invalid net promoter score benchmark, and what should happen automatically once you have a number you can trust.
Net Promoter Score is one line of arithmetic: subtract the percentage of detractors from the percentage of promoters. That's it. The NPS formula has never been the hard part. What's hard is trusting the number that comes out the other end, and knowing what's supposed to happen once you have it. Both of those are where most NPS programs quietly fall apart.
If you're still second-guessing whether your questions are structured to get useful answers, that's a separate problem with its own fix: see our guide to the best NPS questions to ask for how to write and time them, including which lifecycle stage to trigger at. This piece assumes your questions are fine and your responses are coming in, and it picks up from a narrower but equally common version of the same doubt: is your survey structured correctly for the number that comes out of it to actually mean something? Scale consistency, sample size, and segmentation are structural problems too, and they're the ones that quietly invalidate a score even when every question in it was written well.
The stakes here aren't abstract for a PM or CS lead running the program: NPS is usually the one customer-sentiment number that reaches a QBR or a board deck by name, and a score you can't defend when someone asks "why did this move three points" costs you credibility for the next feedback initiative you want budget for.
Why one question carries this much weight
Bain & Company's own account of the research is worth knowing before you calculate anything: Fred Reichheld's team tested dozens of survey questions against actual customer behavior data across 14 industries, looking for the single best predictor of customer loyalty.
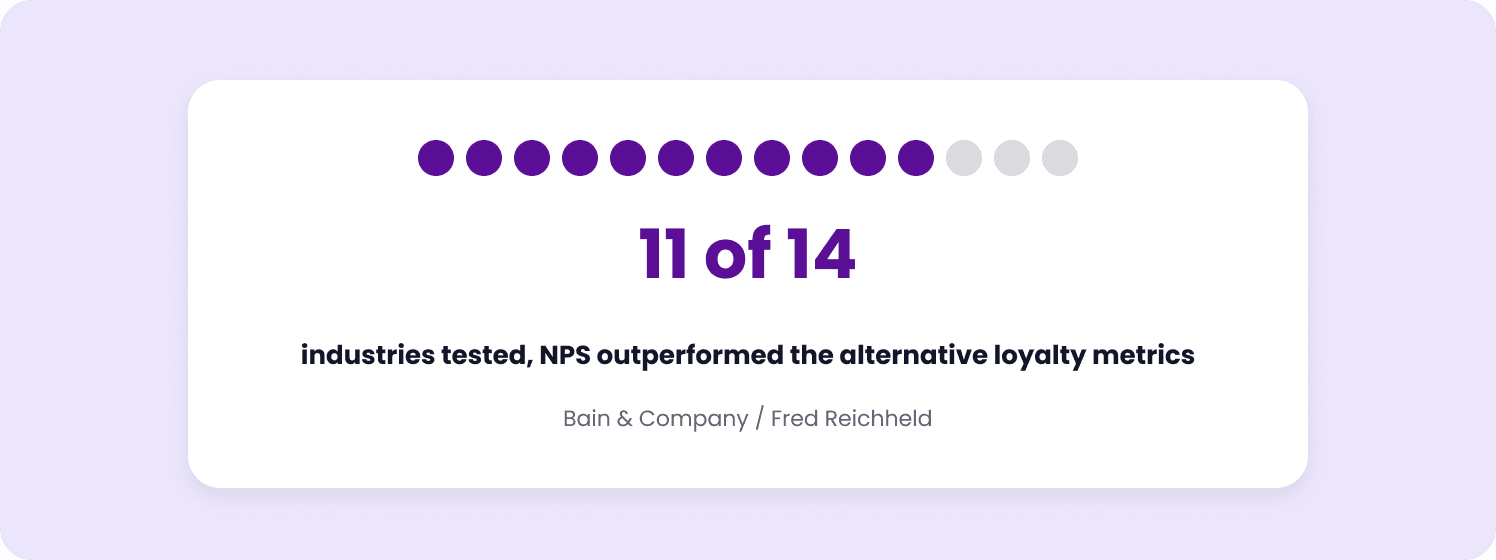
The "how likely are you to recommend" question won, outperforming every alternative in 11 of the 14 industries tested. That's the whole reason NPS earned the trust it has: because the simplicity was validated against real outcomes, one question, unlike a broader product satisfaction survey that asks several across different dimensions. It's also exactly why getting the calculation wrong matters more than it would for a softer metric: you're claiming the predictive power of research that specific.
The NPS formula, stated plainly
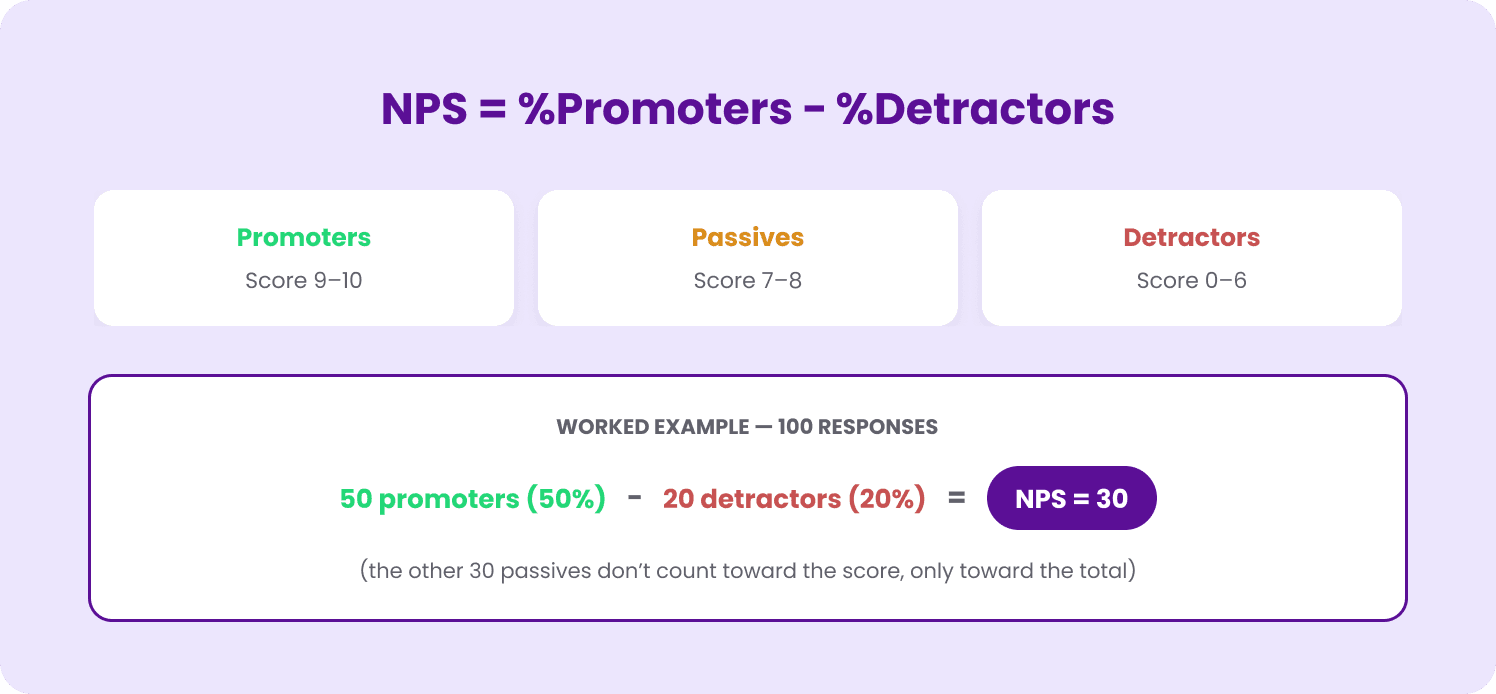
Respondents answer one core question on a 0–10 scale: "How likely are you to recommend [product] to a colleague?" Their score sorts them into one of three buckets:
Promoters (9–10): loyal, likely to expand or refer
Passives (7–8): satisfied but unenthusiastic, vulnerable to switching
Detractors (0–6): unhappy, at risk of churn or negative word-of-mouth
NPS = % Promoters − % Detractors. A base of 100 responses with 50 promoters, 30 passives, and 20 detractors gives you an NPS of 30 (50% − 20%). The result lands somewhere between −100 and +100. That's the entire NPS score calculation. Everything below this is about making sure the number you get out of that formula actually means something.
Where the calculation goes wrong
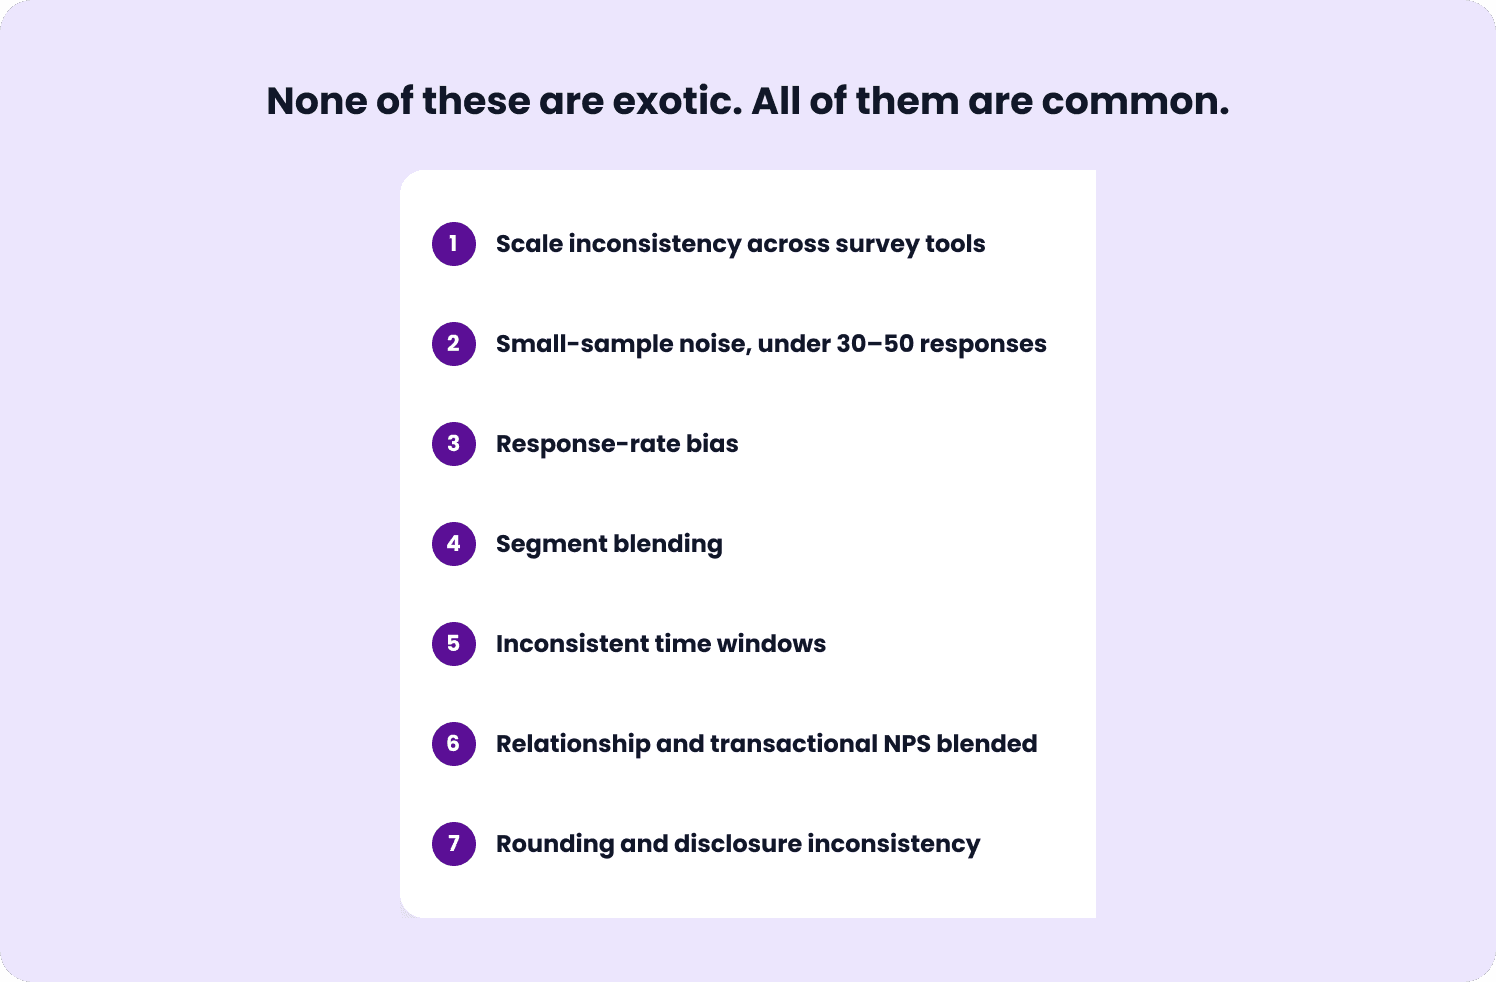
Below, we've listed the seven ways calculation can go wrong with NPS recordings:
Scale inconsistency
The formula only works on the standard 0–10 scale. If a survey tool or a legacy form on your site is still running a 5-point scale from an old CSAT template, you can't fold those responses into your NPS math and get a comparable number. Mixed-scale data doesn't average into a valid score, it produces a number that looks like NPS and isn't. If you're running CSAT and NPS side by side, keep the response pools and the math completely separate.
Small-sample noise
With under 30–50 responses, a handful of detractors can swing the score by ten or more points in either direction. Report a monthly NPS off 12 responses and you're reporting noise. Set a minimum response threshold before you treat a period's score as meaningful, and flag any score built on a below-threshold sample when you share it internally.
Response-rate bias
People with strong opinions, especially unhappy ones, respond to surveys more often than people who are quietly fine. A 15% response rate skewed toward your most engaged or most frustrated users isn't your whole customer base's sentiment, and treating it as such overstates both your promoter enthusiasm and your detractor risk depending on which group happened to respond that week.
Segment blending
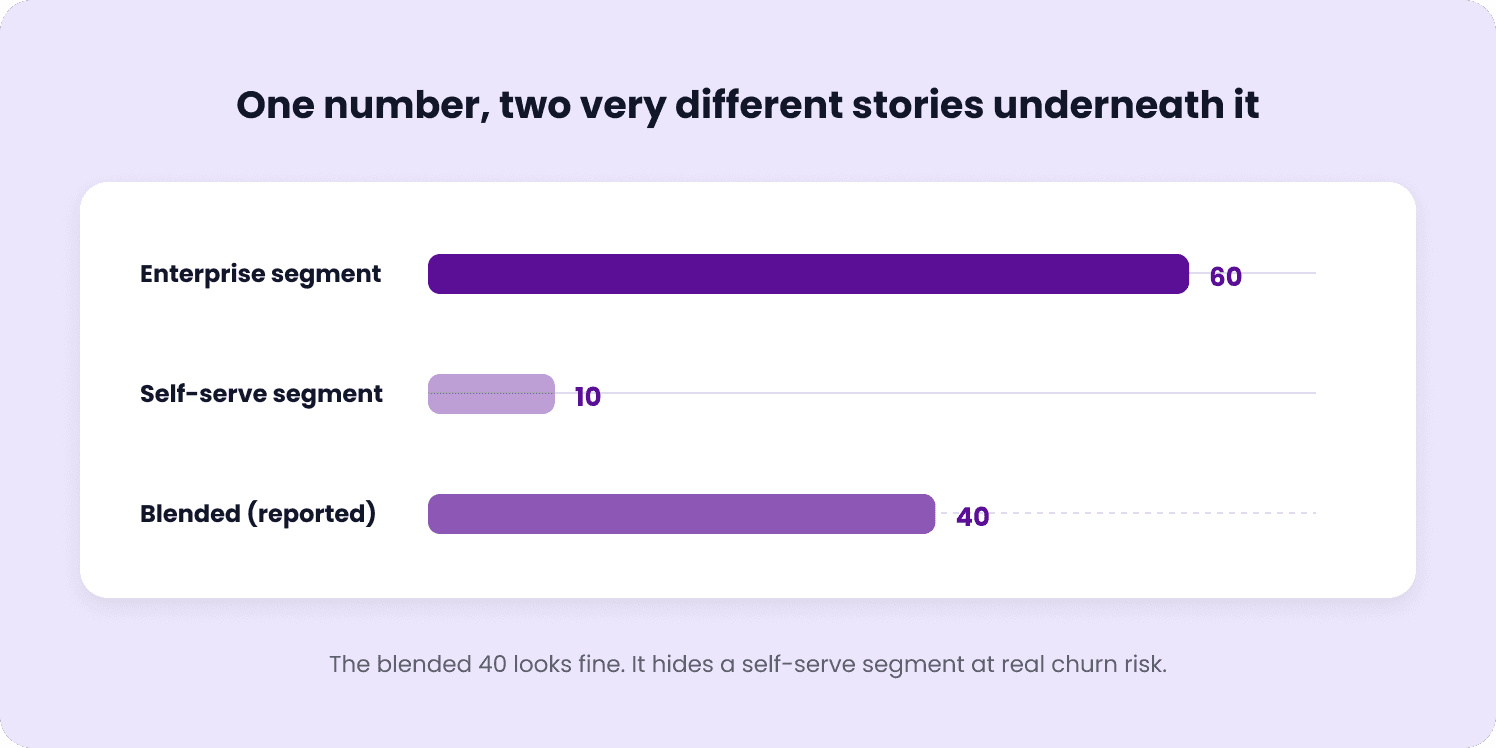
An NPS of 40 sounds healthy until you learn it's an average of an enterprise segment sitting at 60 and a self-serve segment sitting at 10. Blended scores hide exactly the accounts most likely to churn. Calculate NPS per segment, not only in aggregate, if your product serves meaningfully different customer types.
Inconsistent time windows
Comparing a score calculated from a full quarter's responses against one calculated from a single post-launch spike week isn't a trend, it's comparing two different measurement conditions. Keep the collection window consistent if you're going to track movement over time.
Relationship and transactional NPS blended together
A relationship survey ("how likely are you to recommend us overall") and a transactional one triggered right after a specific interaction ("how likely are you to recommend us based on that support conversation") are measuring different things, and averaging them into one number tells you neither how customers feel about the product overall nor how they felt about the specific moment you asked about. Decide which one you're running, calculate them separately, and don't merge the response pools even if both use the same 0–10 scale.
Rounding and disclosure inconsistency
NPS is occasionally reported as a decimal, occasionally rounded to the nearest whole number, and occasionally computed from percentages that were themselves already rounded before the subtraction happened. None of these produce wildly different numbers on their own, but stacked across a few reporting cycles, rounding drift is enough to make a genuinely flat score look like it's trending in one direction. Calculate from raw counts, round once, at the end.
Reading the number once it's calculated correctly
Our guide to NPS questions has the industry-by-industry benchmark table, SaaS typically lands in the 30–40 range, worth checking there instead of repeating it here. What matters more than where you land against any benchmark is the direction and speed of movement in your own score over time. A steady climb from 15 to 25 over two quarters tells you more about whether your product is actually improving for customers than a single-point comparison against a number from a different company's survey methodology ever will.
What to do with it: the part most programs skip
A correctly calculated NPS sitting in a quarterly slide deck doesn't change anything for the customer who gave you the score. The number only earns its keep once it triggers something inside the product, at the account or individual level, close to the moment the response came in. Our guide to NPS questions covers the detractor, passive, and promoter playbooks in detail, what to trigger for each bucket and how to close the loop inside the product, so this piece won't re-derive that. The separate question of when to trigger a survey in the first place is covered in our guide to in-app survey best practices.
What's worth adding here, since it's specific to calculation rather than to action, is that segment-triggered routing is only as good as the segment-level score feeding it. A blended NPS of 40 that's actually a 60 enterprise segment averaged against a 10 self-serve segment doesn't only hide risk in a quarterly report, it also means any bucket-based routing built on the blended number is misrouting: an enterprise detractor and a self-serve detractor both show up as "detractor," with nothing distinguishing which playbook actually fits them. Getting the calculation right per segment, is a precondition for the in-app survey action layer, whether that's a targeted in-app message or an internal CS alert, to route correctly at all.
Zenchef is a useful reference point for what segment-triggered, in-app action can do generally: moving from one-size-fits-all sequences to account-specific, behavior-triggered guidance cut their onboarding time by 53%. The same principle applies to NPS routing, but only once the segment-level number feeding it is one you trust.
One more practical question worth answering directly: how often should you recalculate. Continuously for routing, since a single response should be able to trigger an action the moment it arrives. For trend reporting, monthly or quarterly, whichever matches your response volume closely enough to clear the minimum-sample threshold each period. Recalculating a trend line weekly off a low-volume survey reintroduces the small-sample noise problem from earlier under a different name.
The formula was never the hard part
A correctly calculated NPS is table stakes: get the scale, sample size, and segmentation right and you have a trustworthy number. What separates programs that actually move the score from ones that only report it is whether a detractor response triggers something before the next quarterly review. Get the arithmetic right, then make sure it's connected to something that acts. If you want to see what automated, segment-triggered NPS routing looks like on your own survey data, book a demo with Jimo and get started with a free trial to incorporate NPS capabilities for your business.
FAQs
What NPS score is considered good for B2B SaaS?
Benchmarks vary by industry and by how a company defines its survey population; SaaS typically lands in the 30–40 range. The direction and speed of movement in your own score over time matters more than where you land against any external benchmark.
What mistakes most commonly invalidate an NPS calculation?
Scale inconsistency (mixing a 5-point scale with the standard 0–10), small-sample noise, response-rate bias, blending segments into one score, inconsistent time windows, blending relationship and transactional surveys together, and rounding drift across reporting cycles.
Should NPS be calculated per segment or only in aggregate?
Both, but per segment matters more than it gets credit for. A blended score can hide risk, an enterprise segment at 60 and a self-serve segment at 10 might average to a healthy-looking 40, and it misroutes any segment-based action built on top of the blended number.
What should happen after an NPS score is calculated?
It should trigger something, only get reported. Detractor, passive, and promoter responses each call for a different in-product action, and the value comes from acting on the segment close to when the response arrives.