/
9 mins read

TL;DR
The classic product-market fit survey, asking users how disappointed they'd be without your product, works well early, before there's enough usage data to measure fit directly. Once a SaaS company has paying customers and real cohort history, that same survey stops being the most reliable signal: self-reported sentiment doesn't scale, doesn't segment by cohort, and doesn't catch fit eroding gradually as the product and market shift. This article covers the metrics that actually indicate sustained product-market fit at that stage: retention curve shape by cohort, repeated use of the product's core value action, and expansion behavior, plus how to track fit as an ongoing signal instead of a one-time milestone.
The company clearly had product-market fit at some point. There are paying customers, real revenue, a business that works. What's harder to answer is whether that fit is holding up today, deepening as the product matures, or quietly eroding as the market shifts, and there's rarely a clear source of data to check. This article covers the metrics that actually answer that question, and how to track them on an ongoing basis rather than treating fit as something you measured once and moved on from.
Why the classic product-market fit survey stops working at scale
The most widely used product-market fit test asks one question: how would you feel if you could no longer use this product? If at least 40% of respondents say "very disappointed," the product is considered to have found fit. This is the Sean Ellis test, and it's a legitimate, well-validated signal, for the stage it was built for.
What the Sean Ellis test actually measures well
For an early-stage company, the survey works because there isn't much else to measure yet. A few things make it genuinely useful at that stage:
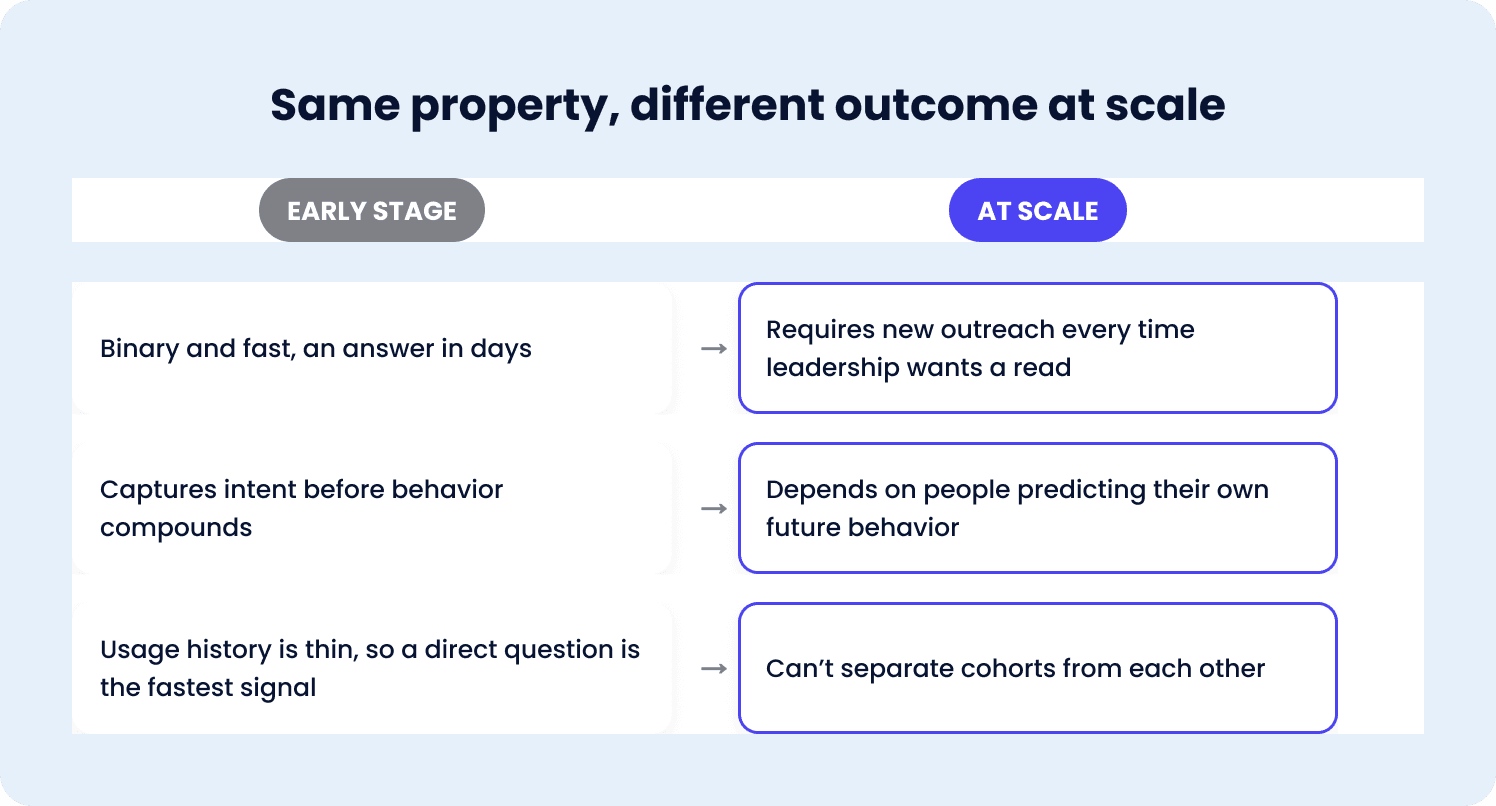
Usage history is thin. There's no cohort data to speak of, so a direct question to a small group of early users is often the fastest signal available.
The question is binary and fast. Does anyone care enough about this yet is exactly the question an early team needs answered, and a survey answers it in days, not months.
It captures intent before behavior has had time to compound. Early users haven't had months to build a habit around the product yet, so asking them directly is sometimes the only available signal.
Where the survey's limits show up at scale
Those same properties become weaknesses once a company has real usage history behind it:
It can't separate cohorts. A single self-reported number can't tell you whether fit is holding steady for customers onboarded eight months ago, who've had time to build the product into their workflow, versus customers onboarded last month, who haven't.
It hides erosion inside an average. A product can look fine in aggregate while fit is quietly eroding for a specific segment, a survey run once a quarter won't catch that until it's already showing up in churn.
It depends on people predicting their own future behavior. "I would be very disappointed" is a prediction, not an observation, and predictions are a weaker signal than watching what people actually do.
It requires new outreach every time leadership wants a read. Each fresh check means a new survey round, more time between the question and the answer.
An established SaaS company has a better option available to it: the product itself already generates a continuous record of whether customers are getting real value. Retention curves, repeated use of the product's core action, and expansion behavior all say more about sustained fit than a quarterly survey, and they update automatically instead of requiring a new round of outreach every time someone wants a current read on where things stand.
The metrics that actually indicate sustained product-market fit
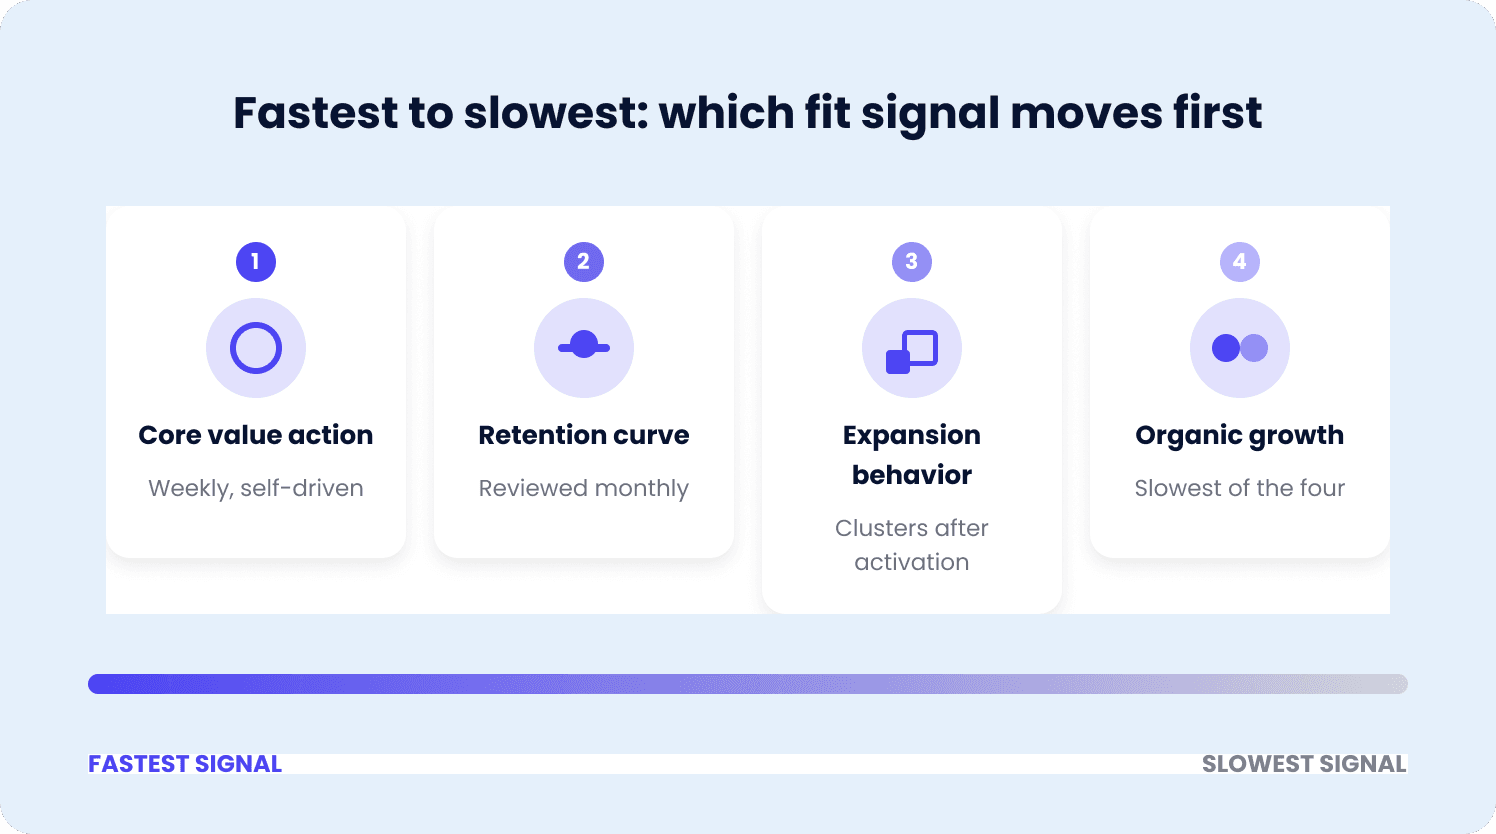
Once a company has enough usage history, four metrics do a better job of indicating whether product-market fit is holding up than any survey question.
Retention curve shape by cohort
A single retention number hides more than it reveals. What matters is the shape of the curve for each cohort, not just where it lands.
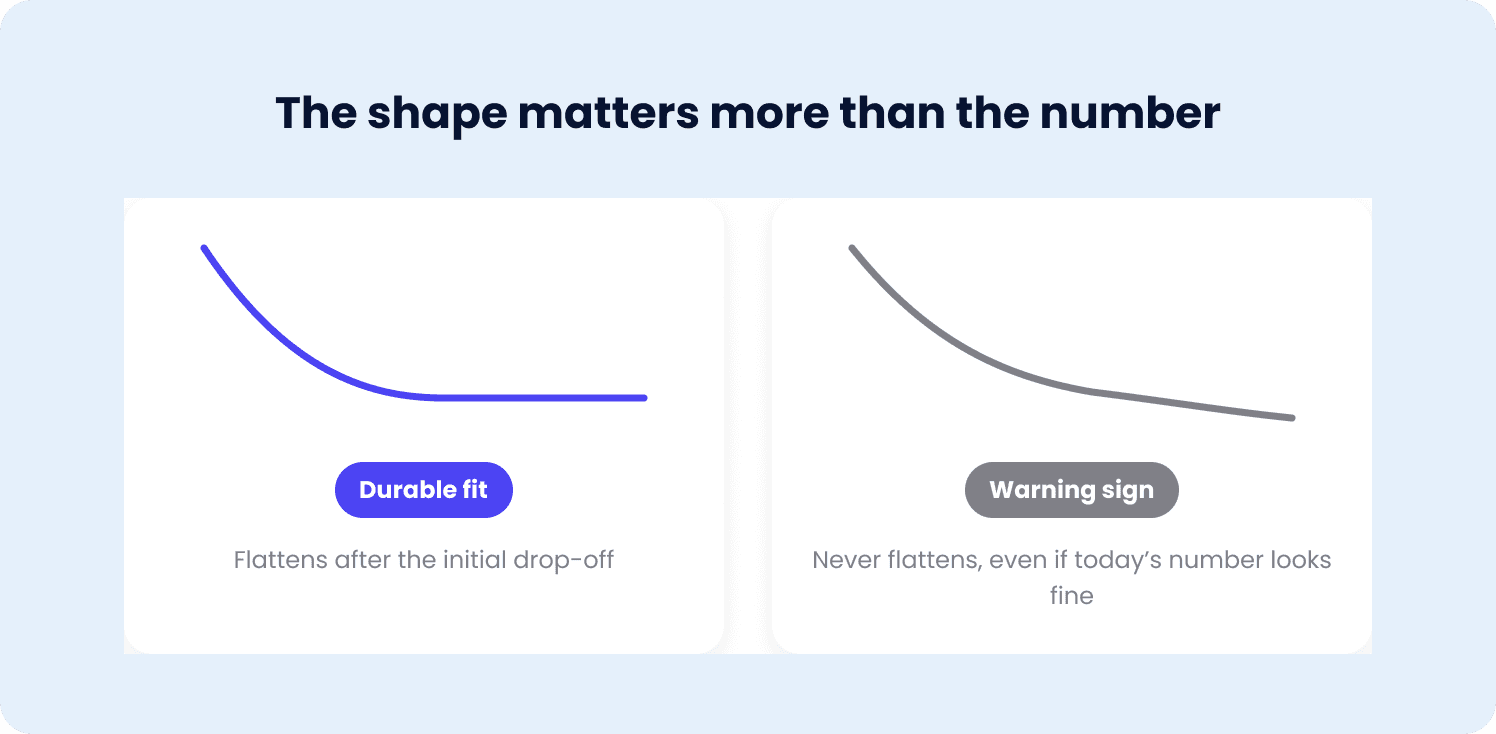
A curve that flattens after the initial drop-off means the customers who stick around keep sticking around. This is one of the strongest available signals of durable fit, especially when multiple cohorts flatten at a similar point.
A curve that never flattens, even if the current retention number looks acceptable today, is a warning sign a survey-based test would never catch, since it only shows up over time.
Comparing cohorts against each other using behavior metrics tracked at the cohort level, not just one aggregate curve, is what actually reveals whether fit is improving, holding steady, or eroding as the product and ICP evolve.
Repeated use of the core value action
Activation measures whether a user reached the product's value once. Sustained fit shows up in whether they keep coming back to do it again, on their own, without a prompt.
A product where users return to the core value action every week without being nudged tells a fundamentally different story than one where a first success never becomes a habit.
Segmenting users by how recently they last completed the core action catches a specific failure mode retention curves alone can miss: a customer who stays subscribed but quietly stops getting value, still on the books, no longer actually engaged.
Expansion and upgrade behavior
Customers don't typically expand a subscription, add seats, or move to a higher tier for a product they're lukewarm about.
Voluntary expansion is a customer acting on a belief that the product is worth more investment, a stronger signal than a stated intention ever is.
Expansion timing matters too: expansion that clusters shortly after a customer hits their core value action repeatedly is a much cleaner fit signal than expansion driven by a sales push.
Organic and referral growth
When a meaningful share of new customers arrive without direct sales or marketing spend behind them, that's existing customers vouching for the product with their own reputation.
It's the slowest-moving of the four signals, changes here take longer to show up than a retention curve or an expansion metric.
It's also one of the hardest to fake or misread, since it requires an existing customer to put their own credibility behind a recommendation.
None of these four metrics replace the others; a company can look strong on one and weak on another. The next section covers how to track them together as an ongoing practice, rather than checking each one in isolation once and moving on.
How to track product-market fit as an ongoing signal, not a one-time milestone
Product-market fit doesn't get measured once and stay settled. Markets shift, competitors launch, ICPs evolve as a company grows, and a product that fit well eighteen months ago can quietly stop fitting as well today without any single dramatic moment marking the change. Treating fit as a milestone that gets checked off obscures exactly the kind of gradual erosion the four metrics above are built to catch.
Build a standing cadence, not a one-off check
The four metrics work as an ongoing signal only if someone is actually looking at them on a schedule, not just when a board meeting or a renewal wave prompts a look.
Review cohort retention curves monthly, comparing the newest cohorts against older ones to catch a shift in shape before it shows up as a churn number.
Track the core value action's return rate on a rolling basis, not as a point-in-time snapshot, since a single month's number can mask a trend that's already underway.
Set a standing owner for the review, not a rotating one. Fit signals are easiest to miss when the person checking them changes every quarter and has to re-learn what normal looks like each time.
Segment before you conclude anything
An aggregate number across the entire customer base can look stable while fit is eroding for a specific segment, and averaging across segments is one of the most common ways this kind of erosion goes unnoticed.
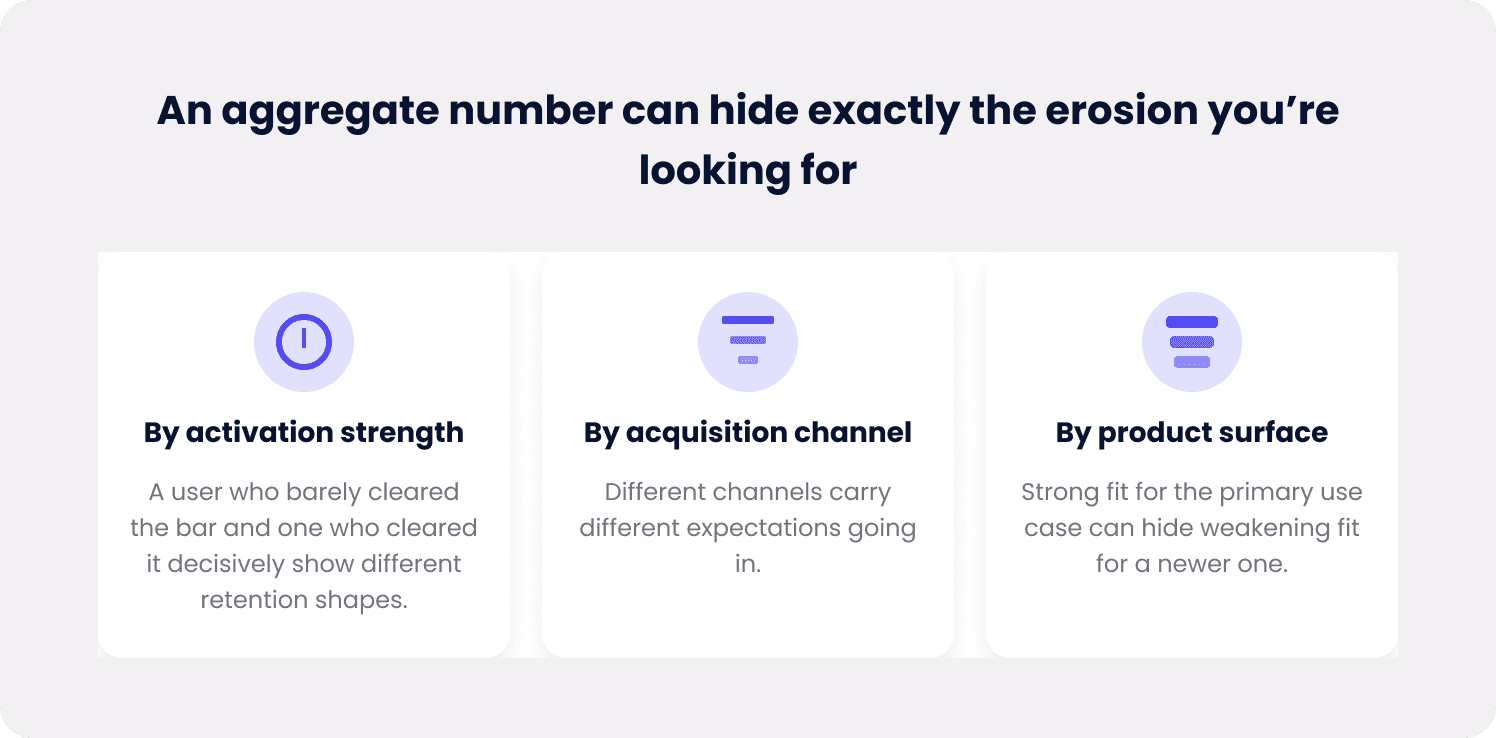
Segment by activation strength, not just plan tier. A customer who barely cleared the activation bar at signup and one who cleared it decisively will show different retention shapes; blending them together hides both stories.
Segment by acquisition channel. Customers who arrived through different channels often have different expectations going in, and fit can look strong for one channel while quietly weakening for another.
Segment by product surface, if the product has more than one core workflow, the same logic that shapes a broader product adoption strategy applies here: a company can have strong fit for its primary use case and weakening fit for a newer one, and an aggregate metric will average the two into something that looks fine.
Set a trigger for when the signal moves
An ongoing practice needs a defined response, not just a defined review cadence. Decide in advance what a declining signal should trigger, before it's declining, so the response isn't improvised under pressure.
Define what counts as a meaningful shift in advance, a curve flattening two weeks later than a prior cohort, or a five-point drop in core-action return rate, so a real signal doesn't get dismissed as noise after the fact.
Decide who gets looped in when the trigger fires. Waiting until a metric has clearly cratered before escalating it usually means the response comes months after the shift actually began.
What changes when you can see product-market fit eroding early
Most companies find out fit has weakened the same way: a quarter of disappointing renewal numbers, or a churn report that's already reflecting decisions customers made months earlier. By the time the standard reporting cycle surfaces the problem, the customers behind it have often already mentally checked out.
The gap between erosion and detection is where the damage compounds
A retention curve that starts flattening later than it used to, or a core value action that a cohort is returning to less often, both show up in behavioral data well before they show up in a churn or renewal report. The companies that catch fit eroding early are the ones already watching the leading signal, not waiting for the lagging one, the same board-reportable product-led growth metrics leadership already tracks quarterly, to confirm what already happened.
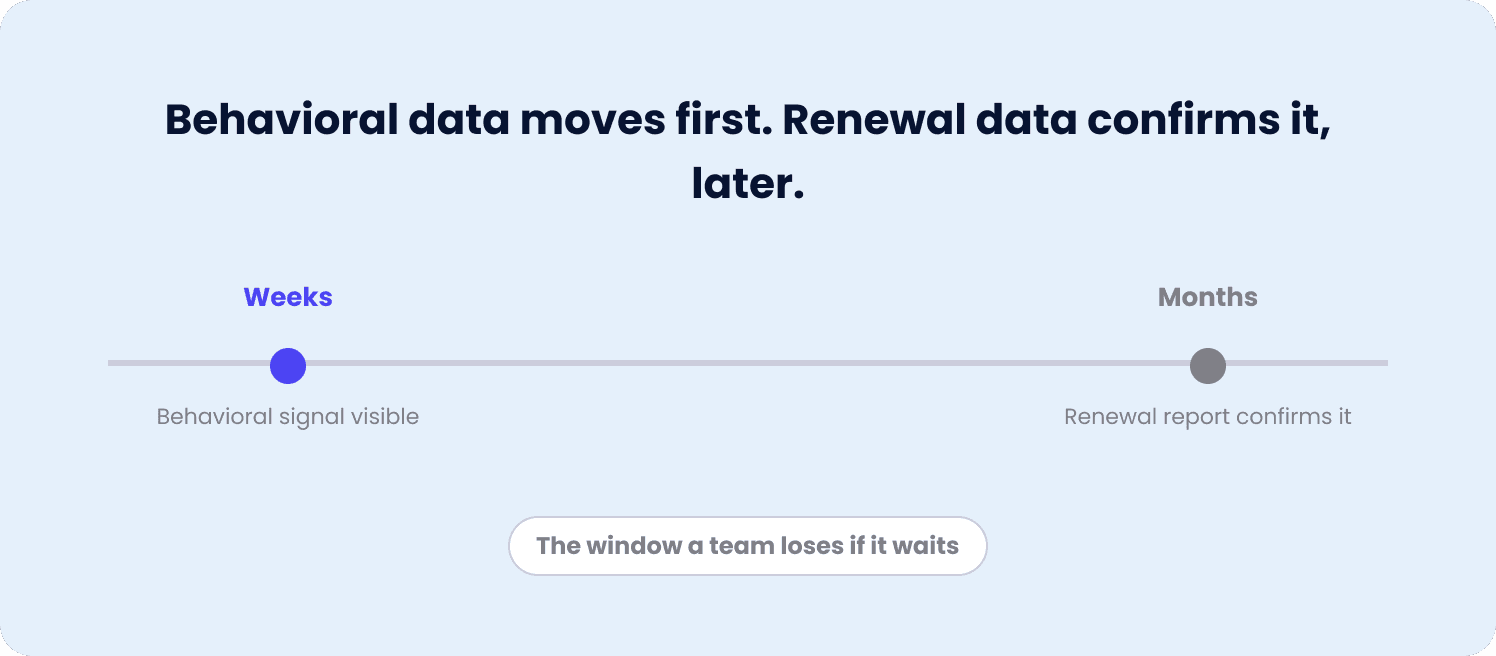
Behavioral data moves first. A change in how often customers return to the core value action is visible within weeks. A change in renewal rate isn't visible until the renewal actually comes due, which can be months later.
Early detection turns a retention problem into a product problem you can still act on. A team that sees a cohort's engagement softening three months in has time to investigate, whether that means fixing the core flow or working to increase adoption of underused functionality. A team that finds out at renewal has a much narrower set of options left, most of them reactive.
Give product-market fit a standing metric, not a one-time Survey
Product-market fit isn't a milestone a company reaches once and moves past. It's a condition that has to hold up as the product matures, as the market shifts, and as the customer base grows past the group that first validated it. A survey run once, months or years ago, can't tell a VP of Product whether that's still true today.
The four metrics covered here, retention curve shape by cohort, repeated use of the core value action, expansion behavior, and organic growth, all update continuously, because they're built from what customers actually do rather than what they predict they'd feel. Segmented correctly and reviewed on a standing cadence, they catch erosion while there's still time to act on it, not months later in a renewal report.
For the deeper build on turning these behavioral signals into a board-reportable metrics system, see our guide on product-led growth metrics.
FAQs
What is product-market fit, and how is it different from early traction?
Product-market fit is the point at which a product reliably delivers enough value that customers keep using it and paying for it without heavy ongoing persuasion. Early traction, a few signups, some initial revenue, can happen without real fit behind it. The distinction matters because traction can be temporary, driven by novelty or a single well-timed launch, while genuine fit shows up as sustained, repeated usage over time.
Is the Sean Ellis "40%" survey still a reliable way to measure product-market fit?
It's a legitimate, well-validated signal for an early-stage company with limited usage data to draw on. It becomes less reliable once a company has real cohort history, since a single self-reported number can't separate how different customer segments or cohorts are actually faring, and it depends on people predicting their own future behavior rather than observing what they actually do.
What retention metrics indicate strong product-market fit?
The shape of the retention curve matters more than any single retention number. A curve that flattens after the initial drop-off, especially when multiple cohorts flatten at a similar point, indicates the customers who stick around keep sticking around. A curve that never flattens is a warning sign worth investigating, even if the current retention percentage looks acceptable.
Can product-market fit fade after a company has already achieved it?
Yes. Markets shift, competitors launch, and a company's ideal customer profile evolves as it grows, all of which can erode fit that was genuinely strong at an earlier stage. This is exactly why treating fit as a one-time milestone is risky: a product that fit well eighteen months ago can quietly stop fitting as well today without a single dramatic moment marking the change.
How often should an established SaaS company re-measure product-market fit?
Rather than a fixed interval, the four core metrics, cohort retention shape, core-action return rate, expansion behavior, and organic growth, should be reviewed on a standing monthly cadence with a defined owner, so a shift in any of them gets caught while it's still forming rather than discovered later in a quarterly report.