TL;DR
Feature adoption software closes the gap between spotting user drop-offs and fixing them. Most platforms measure completion rates, but only a few track whether interventions drive retention and revenue. Evaluate tools on four criteria: no-code event tracking, same-platform intervention, behavioral triggers, and revenue linkage. Jimo leads on speed and autonomy. Pendo wins on enterprise analytics depth.
Users saw the feature you shipped last Tuesday. Nearly half clicked through the walkthrough. But when you check activation data, only 8% reached the action that actually drives retention.
The issue isn’t visibility. It’s that users stop at exploration. They open the dashboard but don’t create. They try the builder but don’t publish. They get close to value and drop off before it happens.
The top analytics tools for tracking feature adoption show this clearly. You can see where users drop off within hours of launch. But acting on that insight is a different problem. Fixing it means launching guidance, building UI changes, and waiting on engineering to ship. By the time the solution goes live, the original cohort is gone and the adoption window has already closed.
That’s the gap this category solves. Feature adoption software lets product teams intervene immediately, so features actually impact activation, retention, and expansion. This guide compares the best feature adoption software tools for 2026, focusing on which platforms let you identify drop-offs and fix them in the same workflow, without waiting on engineering.
Why feature releases underperform (and what adoption software fixes)
Most feature launches are designed around exposure rather than behavior change. Teams announce the feature, add a walkthrough, and measure clicks. But none of that guarantees users will complete the workflow that makes the feature valuable.
The real failure point sits one step deeper, when users need to decide, act, and commit. Friction appears due to unclear next steps, too many choices, or missing context.
Analytics tools make this visible fast. Within hours, you can see where users start and where they abandon. But visibility doesn’t change the outcome. And if the systems you use to measure behavior are separate from the systems you need to change it, these actionable insights quickly become outdated.
This insight-to-intervention gap kills momentum. Fixing drop-offs requires:
Engineering to instrument new tracking events
Design to build guidance experiences
Sprint capacity to ship the intervention
Weeks between problem identification and solution deployment
Feature adoption software combines measurement and action in one platform. Product managers spot workflow abandonment Tuesday morning and deploy contextual help the same afternoon.
Behavioral precision matters as much as speed. Generic announcements blast everyone regardless of need. Targeted interventions based on user behavior deliver guidance at friction points:
Completion hints appear only for users who started but didn't finish
Tutorial content surfaces only after failed attempts
Feature updates reach only users whose behavior signals benefit
Traditional analytics tools provide tracking data but stop at insight delivery. You export dashboards, document findings, and file tickets for other teams. Feature adoption software extends through intervention. The platform that measured the drop-off also deploys the fix.
How to connect feature adoption to revenue outcomes
Feature adoption thresholds predict retention with measurable precision. Maybe users who activate a collaboration feature within their first seven days retain at 3x the baseline rate. Or users who complete their first automated workflow within ten days expand to higher-tier plans at 2.4x frequency. These patterns let you frame feature adoption investments in revenue terms rather than user engagement metrics. The evaluation question becomes whether your platform measures these connections automatically or requires manual spreadsheet correlation. Tools with native conversion tracking define activation milestones and automatically measure how completers perform against revenue outcomes. Tools without this capability force you to export user lists, join them with payment data, and build attribution models manually.
How to evaluate feature adoption software
Product managers who ship weekly need tools to track user adoption of new features and act on drop-offs without waiting on engineering. The following seven questions separate platforms that enable rapid experimentation from those that create engineering dependencies.
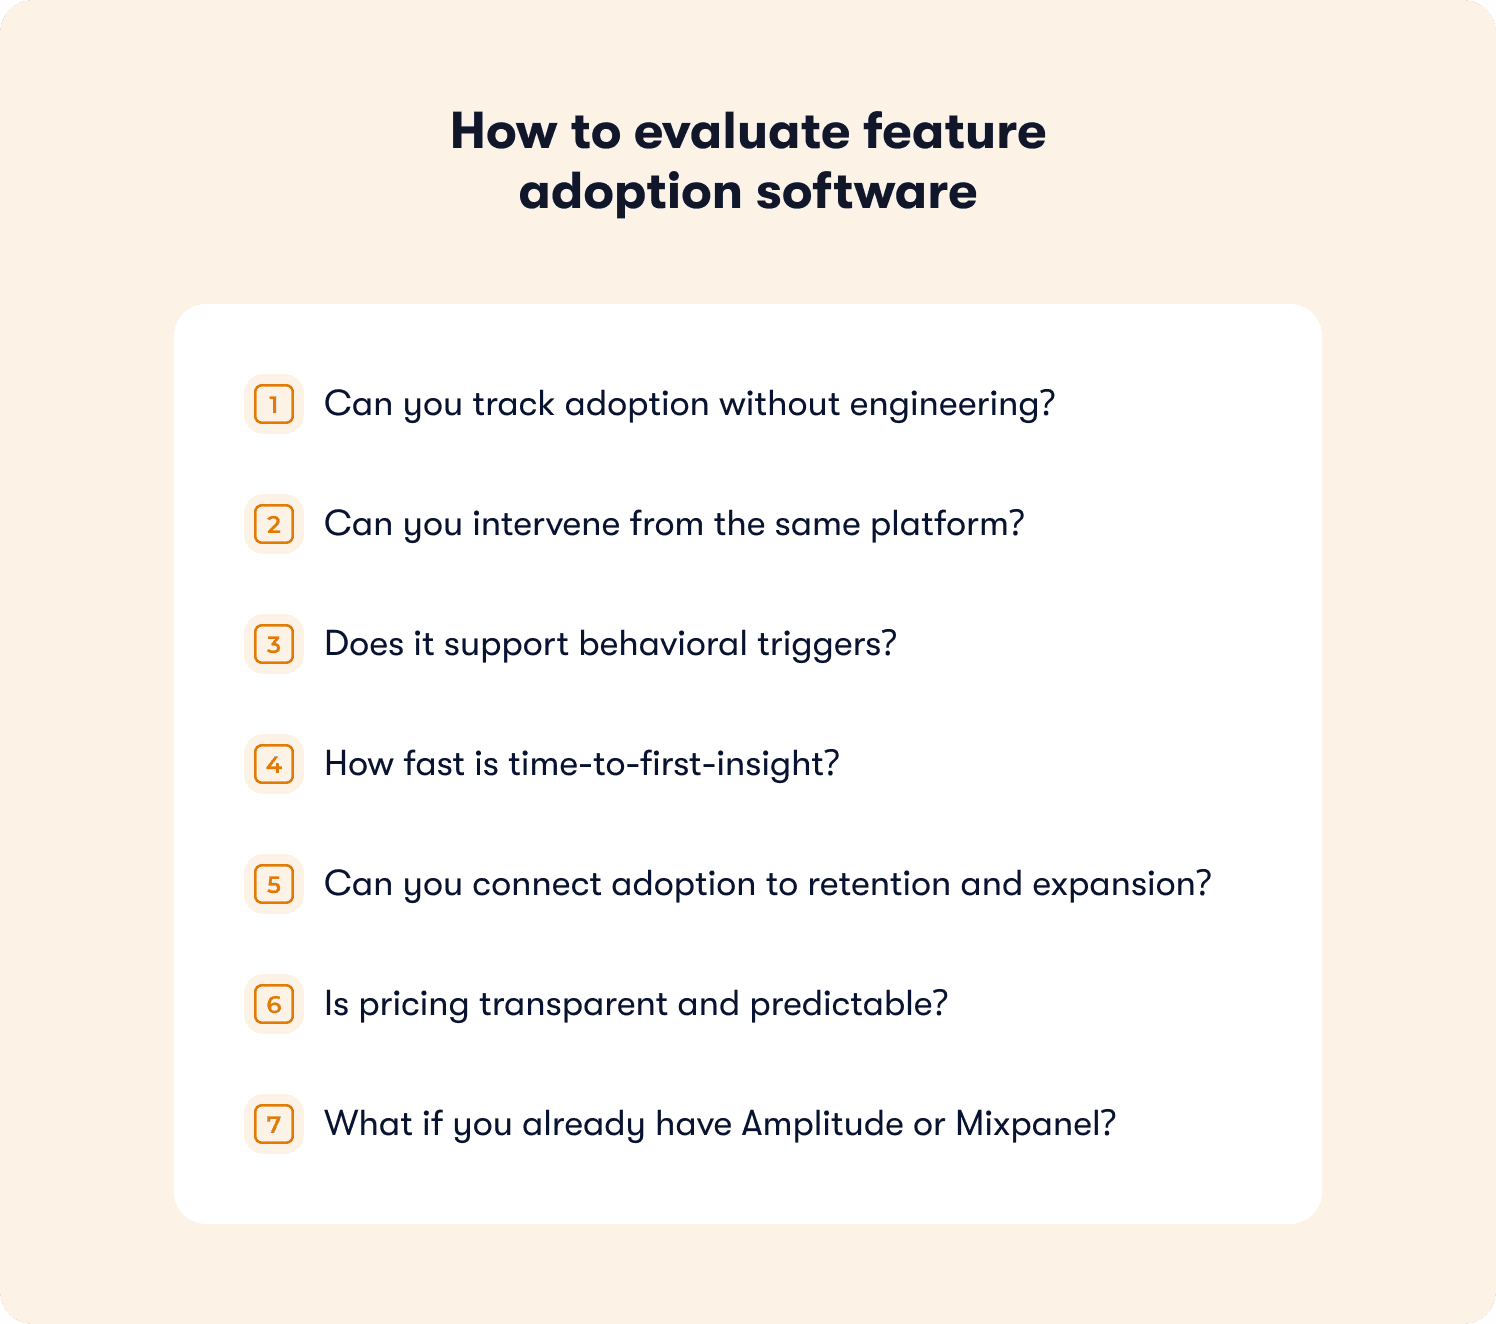
1. Can you track adoption without engineering?
No-code event tagging lets PMs define feature adoption by clicking UI elements rather than filing instrumentation tickets. Visual builders capture selectors when you click your product. You tag “dashboard created” by clicking the creation button. The platform instruments tracking automatically. If measuring adoption requires engineering sprints, you learn what happened weeks after you needed to act.
2. Can you intervene from the same platform?
The delay between insight and action means users drop off before they reach value. Look for platforms where the dashboard showing workflow abandonment also deploys the fix. PMs spot patterns Tuesday morning and launch contextual guidance Tuesday afternoon. Verify support for in-app messaging, hints, and checklists that deploy without engineering releases.
3. Does it support behavioral triggers?
Static “show to everyone” targeting creates noise while missing stuck users. Behavioral triggers target based on actions completed or skipped. Baseline capability targets users who signed up seven days ago but haven't used Feature X. Advanced segmented responses show completion hints only to users who started but haven't finished specific workflows. This precision concentrates guidance where users need it.
4. How fast is time-to-first-insight?
JavaScript snippet installations deliver actionable insights within hours. SDK integrations stretch to days or weeks. Custom instrumentation burns months before the first experiments ship. For product teams at mid-market SaaS companies running lean, velocity compounds because faster learning informs better experiments with actionable insights.
5. Can you connect adoption to retention and expansion?
Revenue linkage answers whether users who adopted Feature X retained at higher rates or expanded to premium tiers. Platforms with native attribution measure trial conversion by onboarding variant. Platforms without this require exporting cohorts and manually correlating with CRM data.
6. Is pricing transparent and predictable?
Monthly active user definitions vary dramatically. Some vendors count every logged-in user. Others count only users who engaged with guidance. This difference doubles effective costs. Pricing that requires you to contact sales makes forecasting impossible. Transparent tiers let you model costs at different scale points before signing.
7. What if you already have Amplitude or Mixpanel?
Analytics platforms excel at tracking user interactions and visualizing funnels. They stop at insight delivery. When Amplitude shows 62% drop off, you still need separate tools or engineering to act. Feature adoption software combines measurement and intervention so PMs launch fixes without filing tickets. This determines iteration velocity and experiments per quarter.
10 best tools for improving feature adoption in 2026
When evaluating feature adoption software, focus on the key features of digital adoption solutions that determine whether your team can both measure and act on user behavior. This table gives you a quick summary of those features, then you can read each tool’s detailed review below.
Tool | No-code iteration by PMs? | Intervention capability | Behavioral triggers | Revenue linkage | Time to first insight | Pricing model |
Jimo | ✅ | ✅ | ✅ | ✅ | Hours | Transparent, starting at $249/mo |
Userpilot | ✅ | ✅ | ✅ | ⚠️ | Days | Transparent, starting at $299/mo |
Userflow | ✅ | ✅ | ✅ | ⚠️ | Days | Transparent, starting at $240/mo |
Product Fruits | ✅ | ✅ | ✅ | ⚠️ | Hours | Transparent, starting at $149/mo |
Chameleon | ✅ | ✅ | ✅ | ⚠️ | Days | Transparent, starting at $279/mo |
Pendo | ⚠️ | ✅ | ⚠️ | ✅ | Weeks | Contact sales |
Appcues | ✅ | ✅ | ⚠️ | ⚠️ | Days | Transparent, starting at $750/mo |
Gainsight PX | ⚠️ | ✅ | ⚠️ | ⚠️ | Months | Contact sales |
Whatfix | ⚠️ | ✅ | ⚠️ | ⚠️ | Months | Contact sales |
WalkMe | ⚠️ | ✅ | ⚠️ | ⚠️ | Months | Contact sales |
✅ = can fully do
⚠️ = can partially do
1. Jimo — Best for same-day measurement and intervention
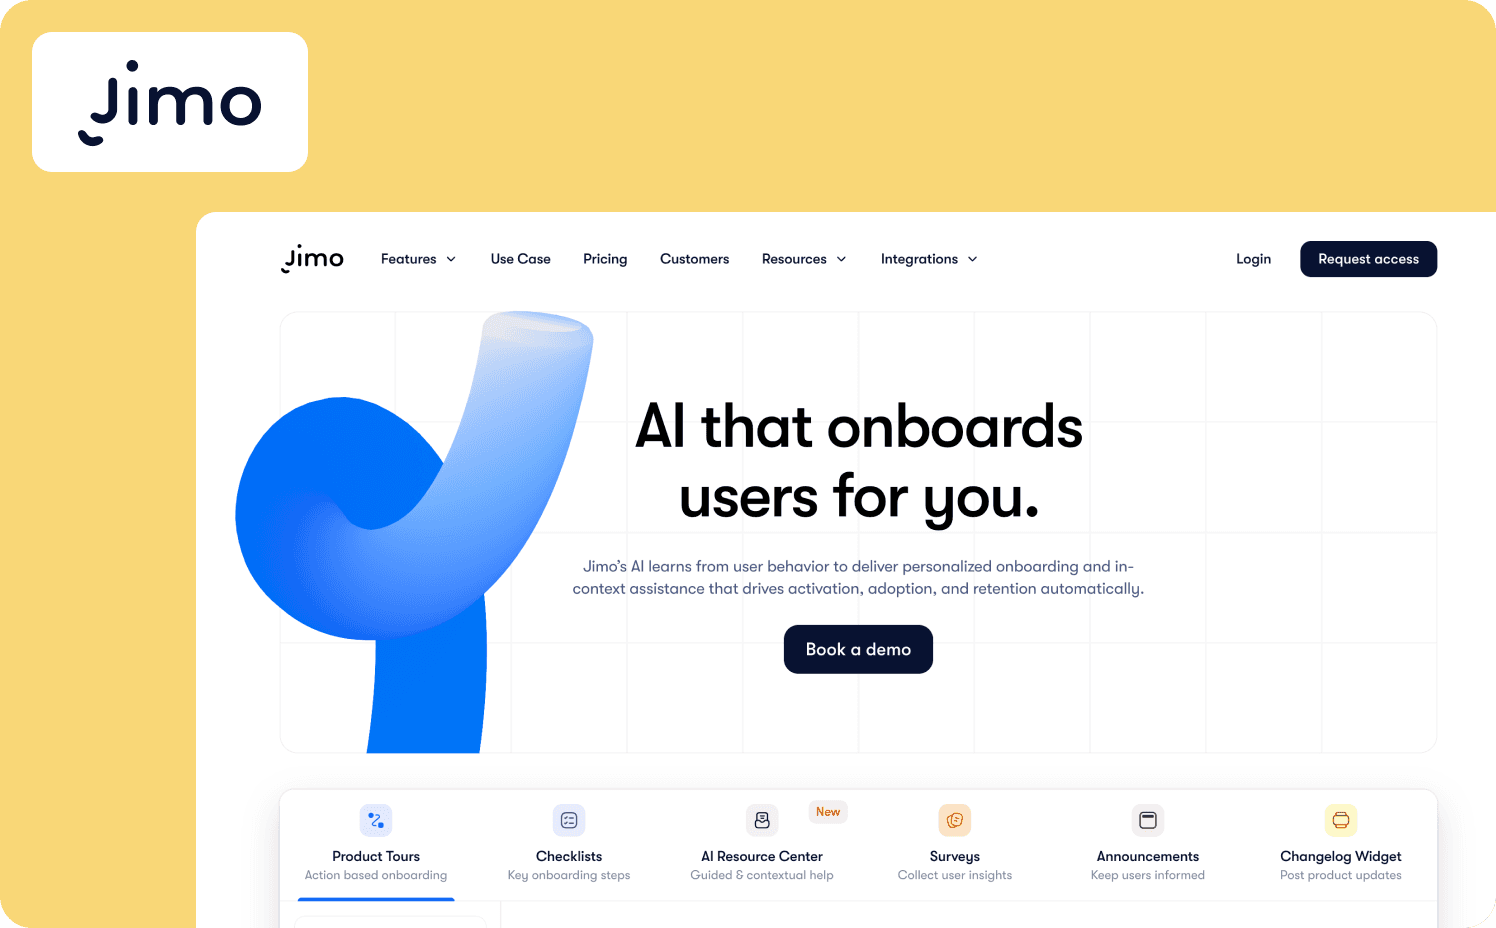
Jimo closes the insight-to-intervention gap by combining no-code event tracking with behavioral guidance deployment. Product managers identify feature adoption drop-offs and launch targeted fixes from the same dashboard. Faster intervention is what allows teams to improve activation while users are still engaged.
Key differentiators:
Success Tracker with visual event tagging: Click any product element to track feature usage without code. Define “feature adopted” by tagging UI interactions through a Chrome extension rather than filing instrumentation tickets.
Same-platform intervention deployment: Launch in-app announcements, contextual Hints, or completion checklists directly from the dashboard showing adoption gaps.
Behavioral trigger precision: Target users based on completed or skipped actions rather than static segments. Show completion hints only to users who opened automation builder but haven't published workflows.
AI-powered tour creation: Record feature workflows once and AI generates complete tour structures including steps, triggers, and progression logic. Action-based tours auto-progress when users complete product actions rather than clicking “Next.”
Revenue outcome visibility: Success Tracker connects feature usage to retention and expansion metrics automatically. View results through customizable analytics segments without manual data correlation.
Instead of rebuilding flows after every release, teams improve guidance continuously based on real user behavior. This increases activation and reduces drop-off over time.
Limitations: Jimo isn’t designed for employee productivity or training on enterprise applications like Salesforce. It’s optimized for web applications rather than legacy desktop or mobile-first products.
Starter: $249/month
Growth: $479/month
Enterprise: Custom pricing
2. Pendo — Best for enterprise Saas companies combining product analytics with in-app guidance
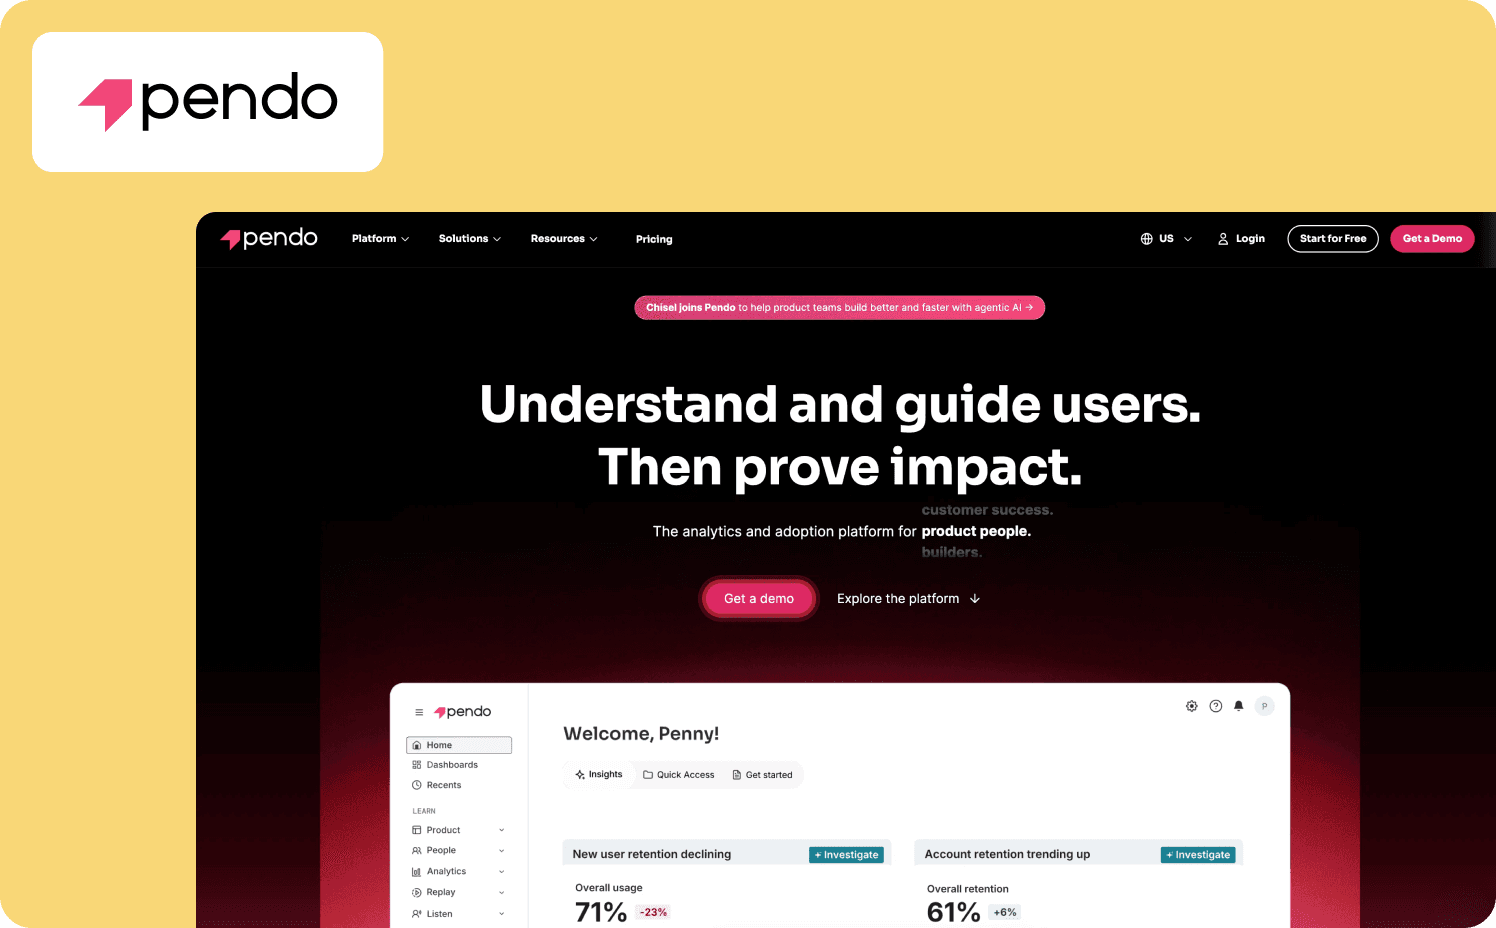
Pendo is a product experience platform that unifies feature adoption tracking with behavioral intervention capabilities. It combines enterprise-grade analytics depth with the ability to launch targeted guidance from the same dashboard.
Key differentiators:
Visual Design Studio enables PMs to define and track user behavior without code using point-and-click selectors or CSS rules for event tagging.
Unified analytics-to-action workflow connects product analytics directly with behavioral guide deployment.
Revenue correlation tracking measures whether feature adoption drives paid conversion and expansion.
Limitations: Even though Pendo advertises itself as no-code, implementation requires significant technical setup. The platform also has a learning curve that demands cross-team training.
Pricing:
Free: For 500 MAU
Base: Custom
Core: Custom
Ultimate: Custom
3. Appcues — Best for no-code event tracking combined with cross-channel messaging
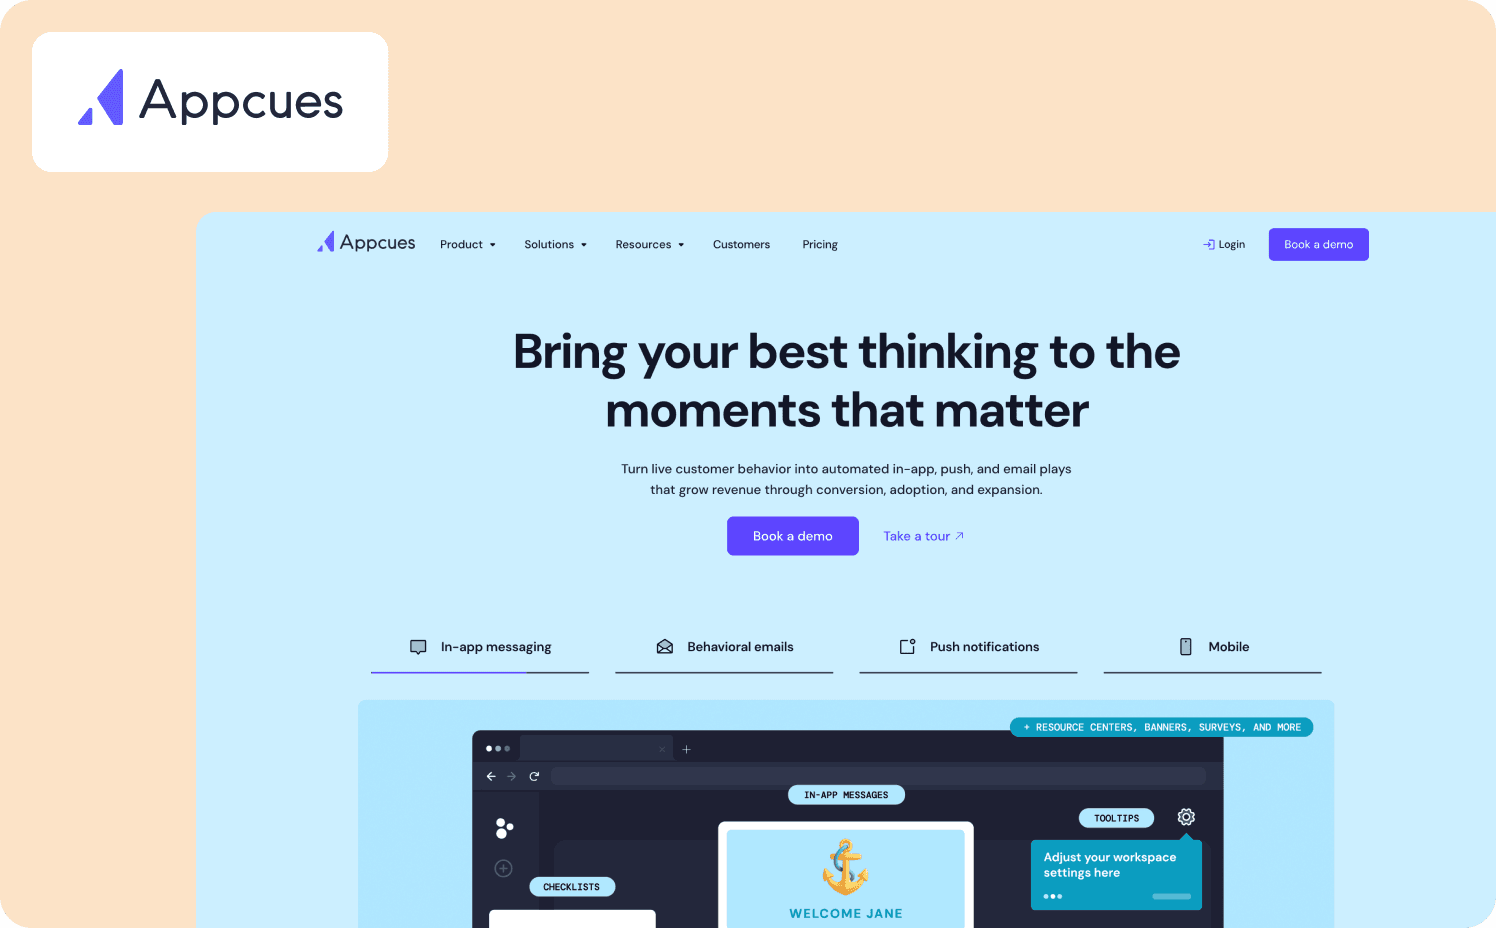
Appcues is a customer engagement platform that removes PM dependency on engineering for feature adoption measurement. The platform combines Click-to-Track event definition with Events Explorer analytics and behavioral messaging across in-app, email, and push channels.
Key differentiators:
Click-to-Track allows PMs to define events by clicking elements directly in the Appcues Builder without code.
Events Explorer visualizes tracked events instantly in charts that save to dashboards for ongoing analysis.
Cross-channel workflow automation triggers in-app flows, behavioral emails, and mobile push notifications in sequences based on user actions.
Limitations: Appcues’ analytics capabilities cover only basic flow performance metrics with limited filtering, visualization, and cohort analysis. Linear tours force predetermined sequences that struggle with dynamic non-linear user behaviors.
Pricing:
Grow: $750/mo for 1,000 MAUs
Enterprise: Custom pricing
4. Userpilot — Best for consolidated analytics and engagement without data silos
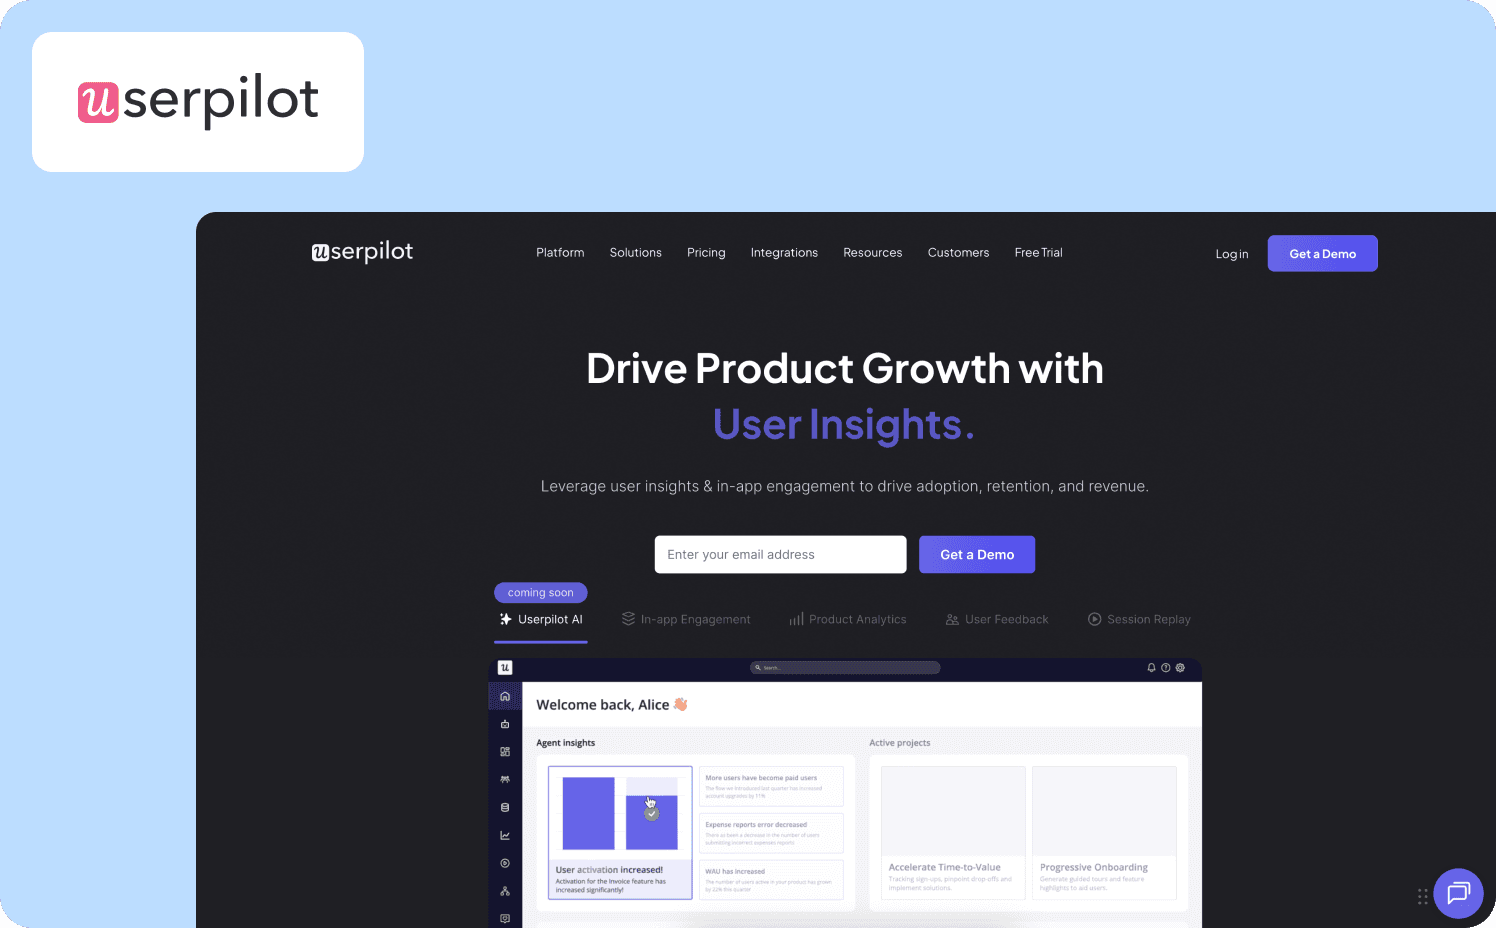
Userpilot is an all-in-one product growth platform that unifies feature adoption tracking, in-app engagement, and user feedback into a single system. Product teams use it to measure how new features perform and immediately act on adoption gaps through contextual guidance and surveys.
Key differentiators:
Event auto-capture with feature tagging tracks behavior instantly without requiring developer instrumentation.
Custom analytics dashboards surface key metrics like product usage, activation rates, and feature adoption at a glance.
Retention analysis measures ongoing engagement by tracking how often users return after completing key actions.
Limitations: The analytics dashboards lack customization depth compared to dedicated product analytics platforms. Users wanting to take advantage of any advanced features face timely learning curves.
Pricing:
Starter: $299/mo (includes 2,000 MAUs)
Growth: Custom (includes 5,000 MAUs)
Enterprise: Custom (includes 10,000 MAUs)
5. Chameleon — Best for design-conscious teams requiring brand control
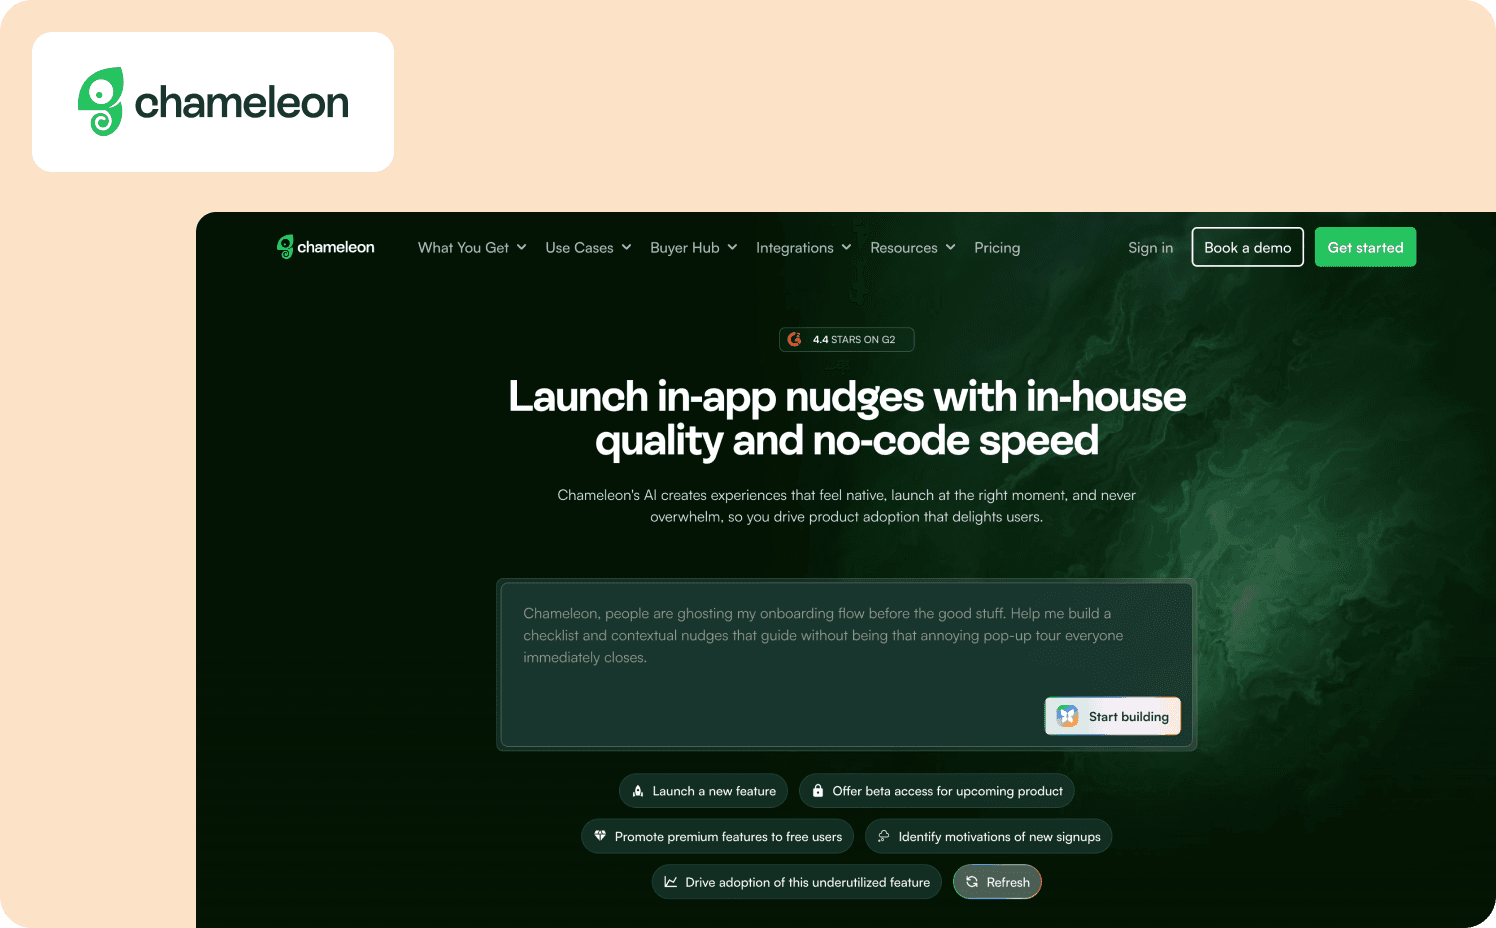
Chameleon is a digital adoption platform built for teams who refuse to compromise on visual precision. Design teams use full custom CSS control to match every in-app experience to brand guidelines while running experiments to optimize what drives adoption.
Key differentiators:
Conversion Goals let teams define success beyond tour completion by tracking custom events like feature usage or workflow completion.
Native analytics push experience data to existing analytics stacks
Figma integration bridges design and deployment through the Chameleon Components file where designers establish branded styling before implementation.
Limitations: Setup, CSS customization, and ongoing maintenance require technical knowledge. Chameleon has limited analytics compared to competitors.
Pricing:
Free: Unlimited product-connected interactive demos
Startup: From $279/mo (1,000 MAUs)
Growth: From $15,000/year (1,000 MAUs)
Enterprise: Custom
6. Whatfix — Best for combining analytics with continuous training environments
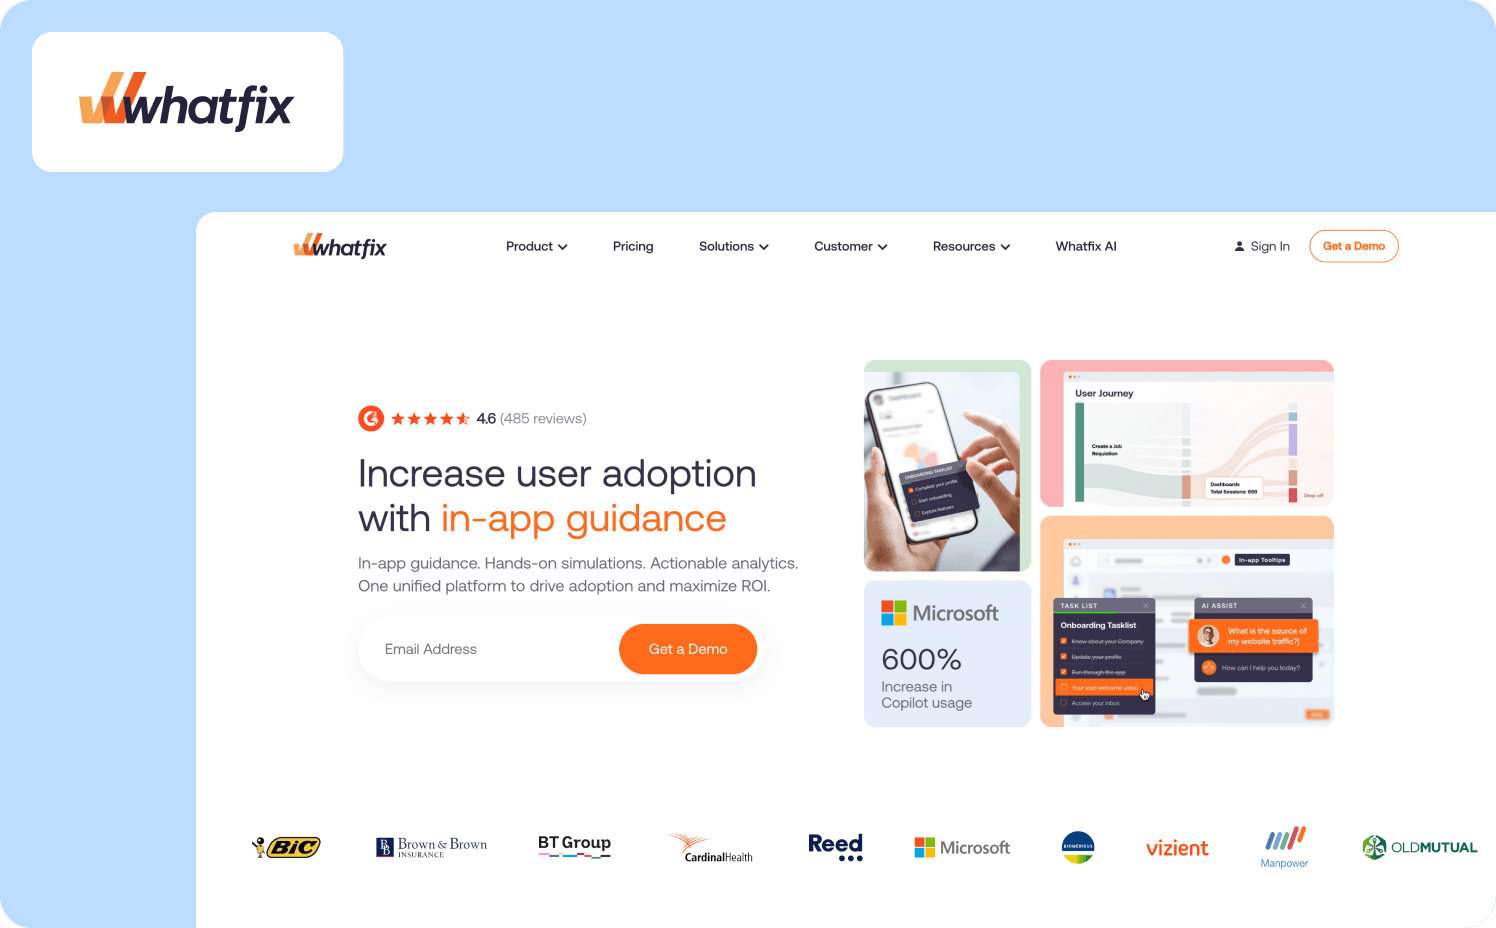
Whatfix is a comprehensive digital adoption platform that unifies no-code product analytics with in-app guidance and simulated training environments. Teams track feature adoption through event-based analytics while delivering contextual support at the moment users need it.
Key differentiators:
Goals map business KPIs to user tasks and measure completion through real workflows rather than claimed completion.
Funnels identify drop-off points and conversion rates across feature adoption workflows.
AI Insights transform usage data into recommendations
Limitations: Whatfix’s implementation can take anywhere from weeks to months and requires specialized resources. The lack of transparent pricing can also be worrying for smaller teams.
Pricing:
Standard: Custom
Premium: Custom
Enterprise: Custom
7. Userflow — Best for no-code event tracking across feature adoption campaigns
Userflow is a digital adoption platform built for non-technical teams to set up event tracking and feature adoption campaigns without developer involvement. Teams deploy targeted flows when users haven't engaged with specific functionality to drive discovery over time.
Key differentiators:
Button click tracking measures engagement with specific features directly within the interface.
Feature adoption campaigns target users who haven't engaged with specific functionality.
A/B testing uses random attributes to test all aspects of user onboarding flows.
Limitations: Compared to dedicated product analytics platforms, Userflow’s analytics capabilities are limited. The platform also lacks advanced features found in larger digital adoption suites.
Pricing:
Startup: From $240/mo (3,000 MAUs)
Pro: From $680/mo (10,000 MAUs).
Enterprise: Custom
8. WalkMe — Best for enterprise teams combining adoption analytics with workflow automation
WalkMe is a digital adoption platform with feature adoption tracking and workflow automation for enterprise deployments. Teams can monitor software usage patterns while deploying guidance that adapts to where employees struggle most.
Key differentiators:
Usage tracking analyzes engagement across workflows.
Automation eliminates repetitive tasks and enforces process compliance.
Form analytics measure data entry completion and accuracy.
Limitations: Setting up WalkMe requires 2-6 months and dedicated technical resources. Because of this, the platform has a steep learning curve that’s not friendly for small-to-midsize teams.
Pricing:
WalkMe for employees: Custom
WalkMe for customer: Custom
9. Product Fruits — Best for small-to-midsize teams who need quick onboarding setup without extensive analytics
Product Fruits is a no-code adoption platform that prioritizes ease of implementation over analytical depth. Teams create tours, checklists, and in-app guidance in minutes without developer involvement.
Key differentiators:
Custom events trigger flows based on user behavior.
The platform tracks aggregate behavior patterns, not individual actions.
Elvin AI copilot resolves support questions directly in-product.
Limitations: Product Fruits’ analytics focus on basic usage and engagement metrics, with limited support for advanced segmentation, funnel analysis, or comparative reporting. The platform also lacks features like session recordings.
Pricing:
Starter: $149/mo (1,500 MAUs)
Pro: $249/mo (1,500 MAUs)
Business: $499/mo (1,500 MAUs)
10. Gainsight PX — Best for product teams who need adoption analytics integrated with customer success operations
Gainsight PX combines product analytics with in-app engagement for teams that coordinate feature adoption measurement with customer success workflows. Automated product mapping enables targeted guidance deployment.
Key differentiators:
Feature Adoption reports capture baseline usage and track changes after interventions.
Adoption Explorer identifies which new features drive retention and correlate with customer lifetime value.
AI-powered product mapping automatically instruments features without manual tagging.
Limitations: Gainsight PX has a learning curve that requires significant time investment across product, marketing, and customer success teams. Initial setup proves overwhelming without dedicated technical resources.
Pricing:
No published pricing
Closing the insight-to-intervention gap
Most teams don’t lack insight, but they lack the ability to act on insights quickly. Fixing a sudden drop-off requires new events, new UI, and a release cycle. By the time the solution ships, the original cohort has already churned or moved on. This delay turns every feature launch into a one-shot attempt. You don’t iterate while users are still engaged, you analyze what went wrong after the moment has passed.
Feature adoption software changes the operating model. Instead of handing off between analytics, design, and engineering, product teams can move from observation to intervention in the same workflow.
Need enterprise advanced analytics depth for complex features? Choose Pendo or Gainsight PX. Training employees on internal tools across multiple applications? WalkMe or Whatfix deliver business process optimization and workflow automation for digital transformations.
For product managers at product-led SaaS companies running weekly activation experiments, Jimo delivers the fastest insight-to-action path. No-code event tracking defines adoption by clicking product elements to track customer behavior and measure feature adoption rate across different user segments. Behavioral triggers target users based on completed or skipped actions. Same-day deployment tests hypotheses this week, not next quarter.
If your team ships new features regularly but struggles to turn them into measurable adoption, Jimo is built for that exact gap. Book a demo to see how Jimo tracks feature adoption and launches in-app guidance without engineering work.
FAQs
How long does feature adoption software take to implement?
Implementation speed depends on platform complexity and technical expertise requirements. Fast-launch platforms (Jimo, Appcues, Userflow) let customer success teams install a JavaScript snippet and create product tours within hours without engineering resources. Enterprise platforms (WalkMe, Whatfix) require months for web applications integration, user segmentation setup, and training your customer support team on advanced capabilities. Choose based on whether you need immediate user adoption wins or comprehensive infrastructure for employee training across multiple applications.
What if we already have Amplitude or Mixpanel?
Product analytics platforms like Amplitude and Mixpanel show you where users drop off but don’t help you fix it. Feature adoption software acts on those insights by triggering in-app guidance, so you can intervene while new users are still active instead of waiting on engineering. Teams often use feature adoption software that integrates with Amplitude or Mixpanel, or one comprehensive solution if they don’t need advanced analytics.
How do I prove ROI during a trial?
Focus on adoption metrics that predict long-term user adoption and revolve around retention-predictive actions, like creating dashboards, setting up integrations, and inviting teammates. Measure whether users engage with key features after seeing guidance, compare feature usage between guided versus self-service users, and calculate trial-to-paid conversion lift. The goal is to prove that guiding users through interventions improved user satisfaction, reduced customer support workload, and cut support tickets.
What's the difference between feature adoption software and a DAP?
Digital adoption platforms create in-app guidance to help users adopt software, whether employee training on Salesforce or user onboarding for SaaS products. Feature adoption software is marketing terminology for DAPs optimized for product teams rather than IT departments — platforms like Jimo, Pendo, and Appcues are all DAPs. The real distinction is what the platforms measure. Legacy tools track task completion and compliance, while modern platforms track user retention, activation, and revenue to prove customer success and business outcomes.