/
8 mins read
TL;DR
Most SaaS onboarding processes are built around one goal: completion. That's the wrong goal, and it's why trial-to-paid conversion stays flat even when completion rates look fine. This article is for CPOs and VPs of Product who already have onboarding in place and need to understand why it isn't moving revenue. Knowing how to run a successful SaaS onboarding process in 2026 means designing around validated activation events, building segment-specific paths for each stakeholder, and running a weekly iteration cadence that connects onboarding changes directly to conversion. When onboarding is treated as a revenue lever rather than a setup checklist, acquisition spend stops being wasted at the activation layer.
Users sign up. They complete the onboarding flow. They never come back.
Not because the product failed them. Because the onboarding never connected them to real value. Research across 500+ SaaS products by Lenny Rachitsky and Yuriy Timen puts the average activation rate at just 36%. Knowing how to run a successful SaaS onboarding process in 2026 means understanding why that number stays stuck, and it isn't a content problem. It's a measurement and design problem.
Most onboarding processes are architected around what's easy to track (step completions, tour views, checklist progress) rather than what actually predicts conversion.
This article diagnoses the structural reasons why: how activation moments get misidentified, how single-path onboarding fails multi-role B2B accounts, why completion rate is a false positive metric, and what the architectural decisions look like when onboarding is rebuilt around revenue outcomes instead.
Why most SaaS onboarding processes fail to drive paid conversion
The problem most CPOs bring to this conversation isn't "we have no onboarding." It's "our onboarding completes and our conversion is still flat." That's a harder problem, because the data looks acceptable. The flow runs. Users click through. The dashboard shows progress. And yet trial-to-paid conversion doesn't move.
The reason is structural. Most onboarding processes are designed around completion milestones, not activation events. These are not the same thing, and they don't produce the same outcomes. A completion milestone tells you a user reached a step. An activation event tells you a user performed the specific behavior that predicts they'll pay. Building around the former while hoping for the latter is where conversion stalls.
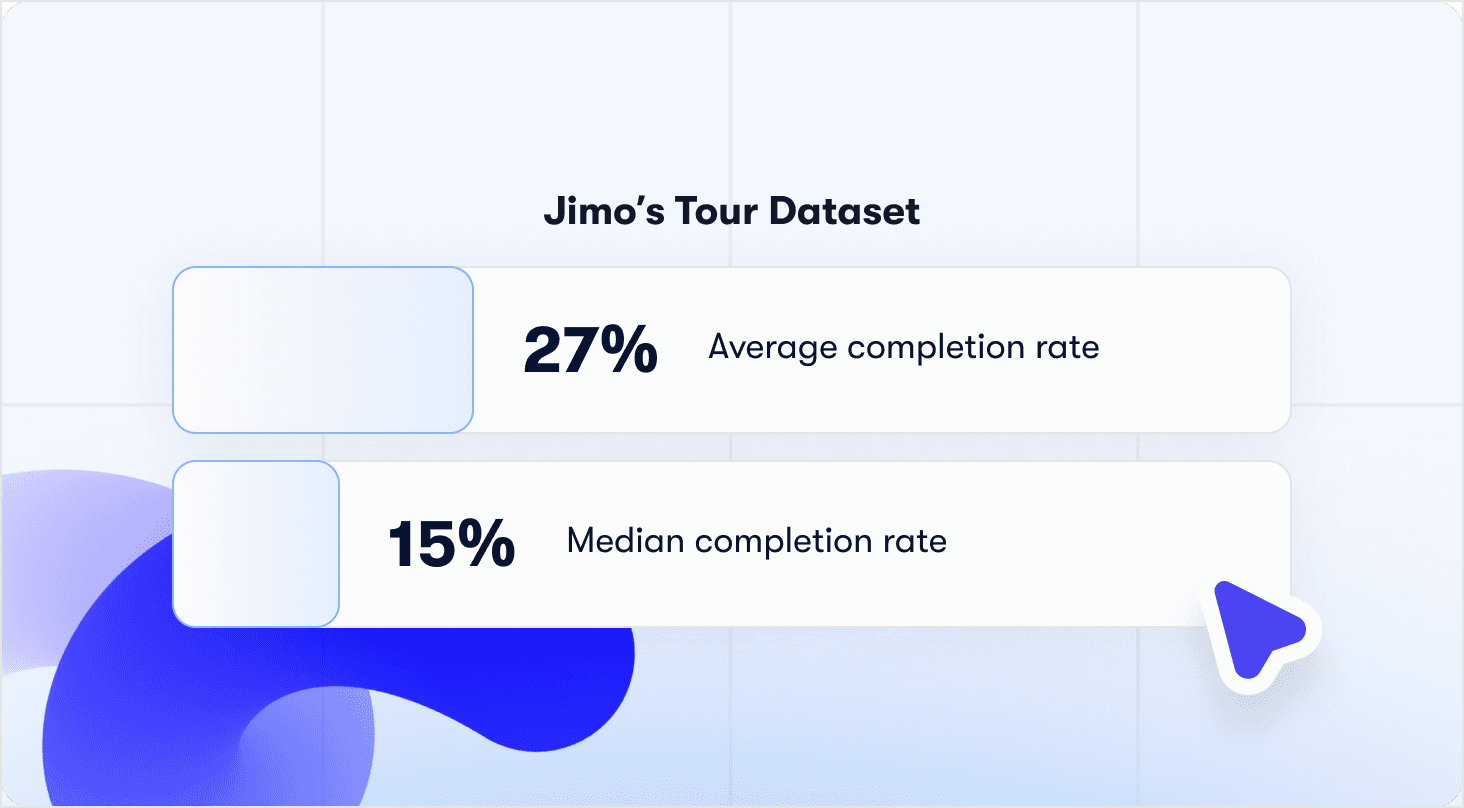
Jimo's analysis of 1,025 product tours in early 2026 puts a number on this: average tour completion sits at 27%, with a median of 15%. But the more important finding is what completion rate doesn't predict: conversion. Teams with above-average completion rates and flat trial-to-paid results are common. The metric that looks like signal is functioning as noise.
For CPOs, the business case is direct. Flat trial-to-paid conversion against growing signup volume means acquisition spend is being wasted at the activation layer, not the awareness layer. The funnel isn't leaking at the top. It's leaking in the middle, where users arrive with intent and leave before reaching value. That's a process architecture problem, not a volume problem. Adding more signups to a broken activation layer compounds the waste.
Three structural decisions determine whether a SaaS onboarding process drives revenue or just completes. How activation is defined. How users are segmented. And how the process is measured. Get these wrong, and a well-designed onboarding flow will keep producing the same outcome: users who finish and don't convert. The rest of this article addresses each one in sequence.
What is a SaaS activation moment (and how to find yours)
Activation is not a feeling. It's not "users understand the product" or "users complete onboarding." For a CPO, activation has one definition: the specific in-product behavior that predicts trial-to-paid conversion at a statistically meaningful rate. Everything else is a proxy, and proxies produce false confidence.
The distinction matters because most onboarding processes are optimized around the proxy. Users complete a checklist, watch a tour, fill out a profile. None of those steps are wrong. But if they don't route users toward the behavior that actually predicts conversion, they're decorative infrastructure.
What a real activation event looks like
The classic examples hold up because they're specific, behavioral, and validated:
Slack: 2,000 messages sent within a team. Not "invited teammates," not "logged in three times." A threshold of actual communication that proved teams were using the product as their primary channel.
Dropbox: The first file upload. One action, immediately predictive of retention because it created a dependency on the product.
Trello: A pre-configured board with zero setup friction. The activation insight was that reducing time-to-first-use predicted retention better than any feature tour.
The pattern across all three is the same: a behavior plus a frequency or depth threshold. "First report generated" is a start. "Three reports generated within seven days" is an activation event. The threshold is what separates a curiosity interaction from a committed one.
How to validate your activation event
Before redesigning anything around a candidate activation event, validate it. The method is cohort analysis, and the standard is a 2x conversion rate difference:
Identify users who retained and converted to paid in the first 30 days.
Identify users who churned in the same window.
Find the behavior that consistently separates the two cohorts.
Test the threshold: do users who hit the event convert at 2x or more the baseline rate?
If the conversion rate difference isn't at least 2x, the event isn't the right one. Keep testing. Teams that skip this step design their entire onboarding around an unvalidated assumption, then wonder why iteration doesn't move the needle.
What happens when you get it right
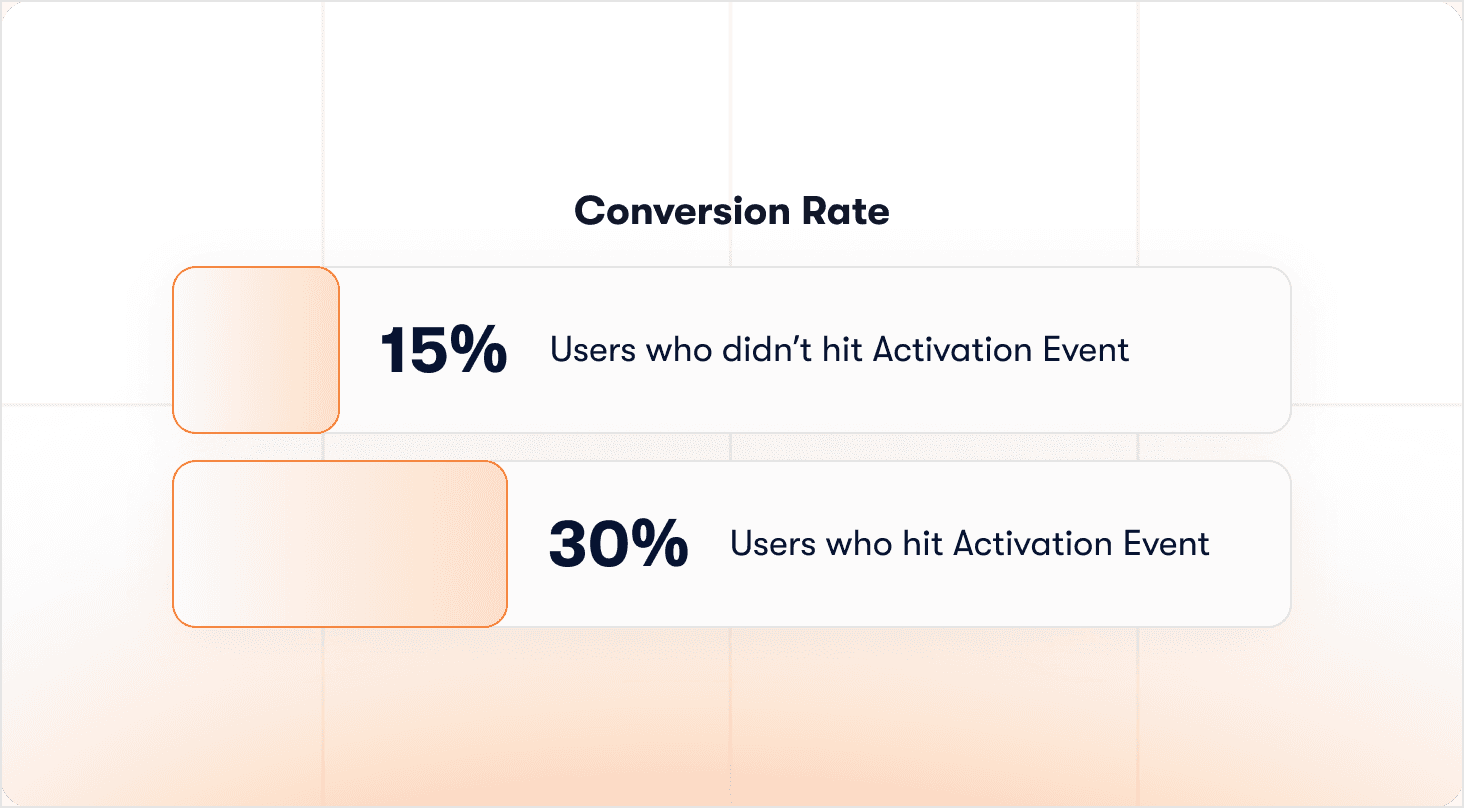
Rocketbots identified the correct aha moment for their product and rebuilt their entire onboarding path around it. Activation went from 15% to 30%. MRR grew 300%. The product didn't change. The onboarding architecture did, because it was now pointing every user toward the one behavior that actually predicted they'd stay.
That's the implication for CPOs running a successful SaaS onboarding process: most onboarding redesigns fail not because the execution is poor, but because the activation event was never validated in the first place. Every design decision downstream of a wrong activation assumption compounds the error. Knowing how to measure product adoption correctly is the prerequisite for getting this right.
How to personalize SaaS onboarding for different user segments
A single onboarding path produces averaged outcomes. That's the CPO-level problem with generic flows: the aggregate activation rate hides the real story. An overall 30% activation rate can conceal a 50% rate for one persona and 15% for another, and the process treats both identically. You're optimizing for an average that no individual user actually represents.
Segmentation is an architectural decision that has to be made before any flow is built. The question isn't "how do we personalize the experience?" It's "which variables actually predict different activation paths?" In B2B SaaS, four variables consistently matter:
Role: An admin and an end-user reach entirely different activation events. One path for both means neither gets there efficiently.
Plan tier: Free and paid users have different urgency levels, different feature access, and different definitions of value.
Use case: Two or three qualifying questions at signup are enough to separate users solving fundamentally different problems.
Company size: A solo user activates differently than someone configuring a product for a 50-person team. The invite step alone has different timing implications.
Building paths that branch on behavior, not assumptions
Canva's approach illustrates the principle cleanly. A single qualifying question at signup routes a teacher and a marketer into entirely different first experiences. Both reach their activation moment via a path built around their actual use case. The question doesn't slow them down. It removes the friction of a generic experience that would have served neither well.
The mechanics of making this work without engineering dependency matter as much as the strategy. Jimo's visual tour builder lets product teams design branching onboarding paths with conditions based on element clicks, wait time, and user properties, so each persona follows a tailored flow without a single line of code written. When a path needs adjustment, it's a product team decision, not a sprint request.
The organizational implication most teams skip: segment-specific onboarding requires someone to own each path. If no one owns the PM path versus the developer path, both will drift. Personalization without ownership decays on contact with reality.
The measurement directive
Kontentino separated their agency user flow from their solo marketer flow and saw activation improve 10% within one month. That result came from routing two different user types toward two different success events, not from refining copy in a single shared flow.
Personalized onboarding increases retention by 40% compared to generic flows (Moxo, 2025). Track segmented responses by role, plan tier, and use case from day one. An overall 30% activation rate is strategically meaningless if you can't see which segment is dragging it down. The segment with the lowest rate is where the highest-leverage onboarding work lives.
How to reduce time-to-value in SaaS onboarding
Time-to-value is not a UX metric. It's a revenue metric. Every hour between signup and activation is a window in which users can decide the product isn't worth the effort. Most onboarding processes extend that window unnecessarily, not because teams are careless, but because the process was built around internal logic rather than the user's path to value.
The structural cause is consistent: onboarding steps that serve the product team's sense of completeness rather than the user's route to their activation event. Profile completion, feature tours, team setup wizards. None of these are inherently wrong. But when they front-load the experience before a user has reached a single moment of value, they add time without adding value. And in a trial context, time is the resource users are least willing to spend.
Jimo's analysis of 1,025 product tours makes the stakes concrete: median completion sits at 15%, and every step beyond three or four measurably kills completion. Longer onboarding processes are not more thorough. They're more likely to lose users before they reach value.
The three-component framework
Reducing time-to-value isn't a single design decision. It's a combination of three components working together:
Interactive tours that require real action, not passive clicks. Tours that advance on "Next" let users skip the activation behavior entirely. Action-based tours auto-progress when the user completes the actual task, which means guidance and activation happen simultaneously rather than sequentially. Jimo's AI-powered interactive tours achieve 44% average completion against the 27% benchmark across 1,025 tours analyzed, a gap that compounds directly into activation rate.
Onboarding checklists built around four to six activation-correlated steps, with the first pre-checked. The pre-checked first item isn't a design trick. It signals progress before the user has done anything, which reduces the perceived effort of starting. Every item on the list should require the activation behavior, not a click-through that satisfies the step without performing it.
Contextual hints delivered just in time, not front-loaded. Tooltips shown on day one for features a user won't need until day seven are noise. Contextual hints triggered by specific user behavior, at the moment the behavior is relevant, are the difference between guidance that helps and guidance that interrupts.
📖 Looking for real onboarding tactics to plug into this process? → Get 19 proven examples
The empty state problem
There's a time-to-value issue that precedes every onboarding step: the blank dashboard. A new user who lands on an empty product interface spends untracked minutes in confusion before any guided experience begins. Airtable's template-first model addresses this directly. New users don't see an empty database. They see a pre-populated workspace that demonstrates value before they've configured anything. The activation path starts from a position of demonstrated value, not a blank canvas.
For CPOs evaluating where time-to-value is bleeding activation, the diagnostic question is simple: does each onboarding step require the activation behavior, or does it only require a click? Steps that can be completed without performing the activation action are adding time without moving users toward conversion. The onboarding checklist article covers the step-level rebuild in detail for teams that need the execution layer alongside the framework.
SaaS onboarding metrics that actually predict conversion
Here's the diagnostic tension most CPOs face and don't name directly: your onboarding dashboard shows healthy completion. Your board deck shows flat conversion. Both are accurate. And that's precisely the problem. If the metrics you're tracking can look good while conversion stalls, you are not measuring signal. You're measuring activity.
The measurement trap is structural. Completion rate became the default onboarding metric because it's easy to instrument and easy to report. It tells you users clicked through a flow. It tells you nothing about whether they performed the behavior that predicts they'll pay. This is where onboarding automation creates a false sense of security: automated flows can run, complete, and report green across the board while activation quietly flatlines.
The three metrics that replace completion rate
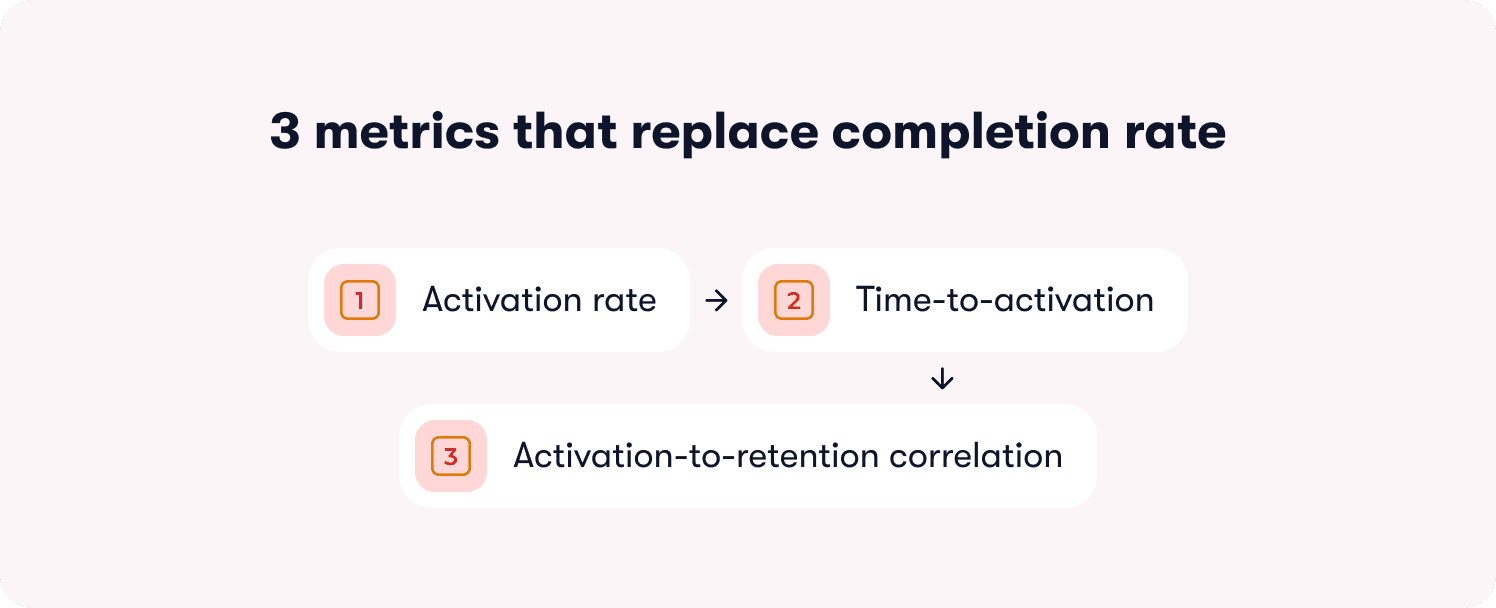
Before changing a single onboarding step, establish whether your current measurement system can actually detect activation. If it can't, every optimization decision made from that data is directionally wrong. The three metrics that matter are:
Activation rate: The percentage of users who reach the defined success event within seven days of signup. This is the north star metric. When it moves, conversion follows. When it doesn't, no amount of completion rate improvement will compensate.
Time-to-activation: The median hours from signup to the first success event. This is where time-to-value becomes measurable. A rising time-to-activation number tells you friction is accumulating somewhere in the path before users reach value.
Activation-to-retention correlation: Do activated users retain at two to three times the rate of non-activated users? If the correlation isn't that strong, the activation event itself may need revalidation. This metric is the check on the activation event definition, not just the onboarding design.
The false positive diagnostic
The most expensive measurement mistake in SaaS onboarding is a false positive: a metric that reports success while the underlying behavior hasn't changed. Completion rate produces false positives by design. A user can satisfy every checklist item without performing a single activation behavior.
The CPO-level audit question for each onboarding step is: can a user complete this without performing the activation behavior? If yes, that step is generating false positive completion data and masking the real drop-off point. This problem gets worse when onboarding data lives in a silo, disconnected from the product analytics and revenue data that would expose the gap. Completion metrics look fine in the onboarding tool. Conversion data looks flat in the CRM. No one is reading them together, so no one sees the structural disconnect.
Superhuman's approach to this problem is instructive. Rather than optimizing onboarding content, they built a measurement system around a single question deployed at the right moment in the user journey, iterated weekly. The competitive advantage wasn't better onboarding. It was a feedback loop tight enough to detect what was working and act on it before the signal decayed.
Real-time signal vs. post-mortem data
Cohort analysis tells you what happened. It doesn't tell you why, and it doesn't tell you in time to intervene before a user churns. The complement to cohort analysis is a one-question friction survey deployed at high drop-off points: a single in-the-moment prompt that captures why users stalled, while the experience is still fresh. Churn data read weeks later is a post-mortem. A friction survey at the moment of drop-off is an intervention.
This is where in-app guidance does double duty. Used well, it can generate the behavioral signal that tells you where guidance is failing. Every interaction, skip, and drop-off point becomes data that feeds the measurement system rather than disappearing into session logs no one reads.
Jimo's behavior metrics and actionable reports connect specific onboarding guidance interactions to activation, trial-to-paid conversion, and 90-day retention cohorts directly. The result is a measurement layer where a CPO can see which onboarding investments are producing revenue signals and identify which steps are generating false positives before they corrupt the optimization roadmap. Running a successful SaaS onboarding process in 2026 depends on having that closed loop in place before any design iteration begins.
How to build a SaaS onboarding optimization process
Most CPOs treat onboarding as a project. Designed once, reviewed quarterly, updated when conversion numbers become impossible to ignore. That's not an optimization process. It's a maintenance schedule, and it's why onboarding at most companies improves at roughly the same pace as the products it's supposed to support.
The companies with the best activation rates aren't the ones who designed the best onboarding. They're the ones who iterate the fastest. That requires an organizational cadence, not just better tooling.
The weekly operating rhythm
A weekly cadence isn't a PM task list. It's an organizational design decision that determines whether onboarding compounds or stagnates:
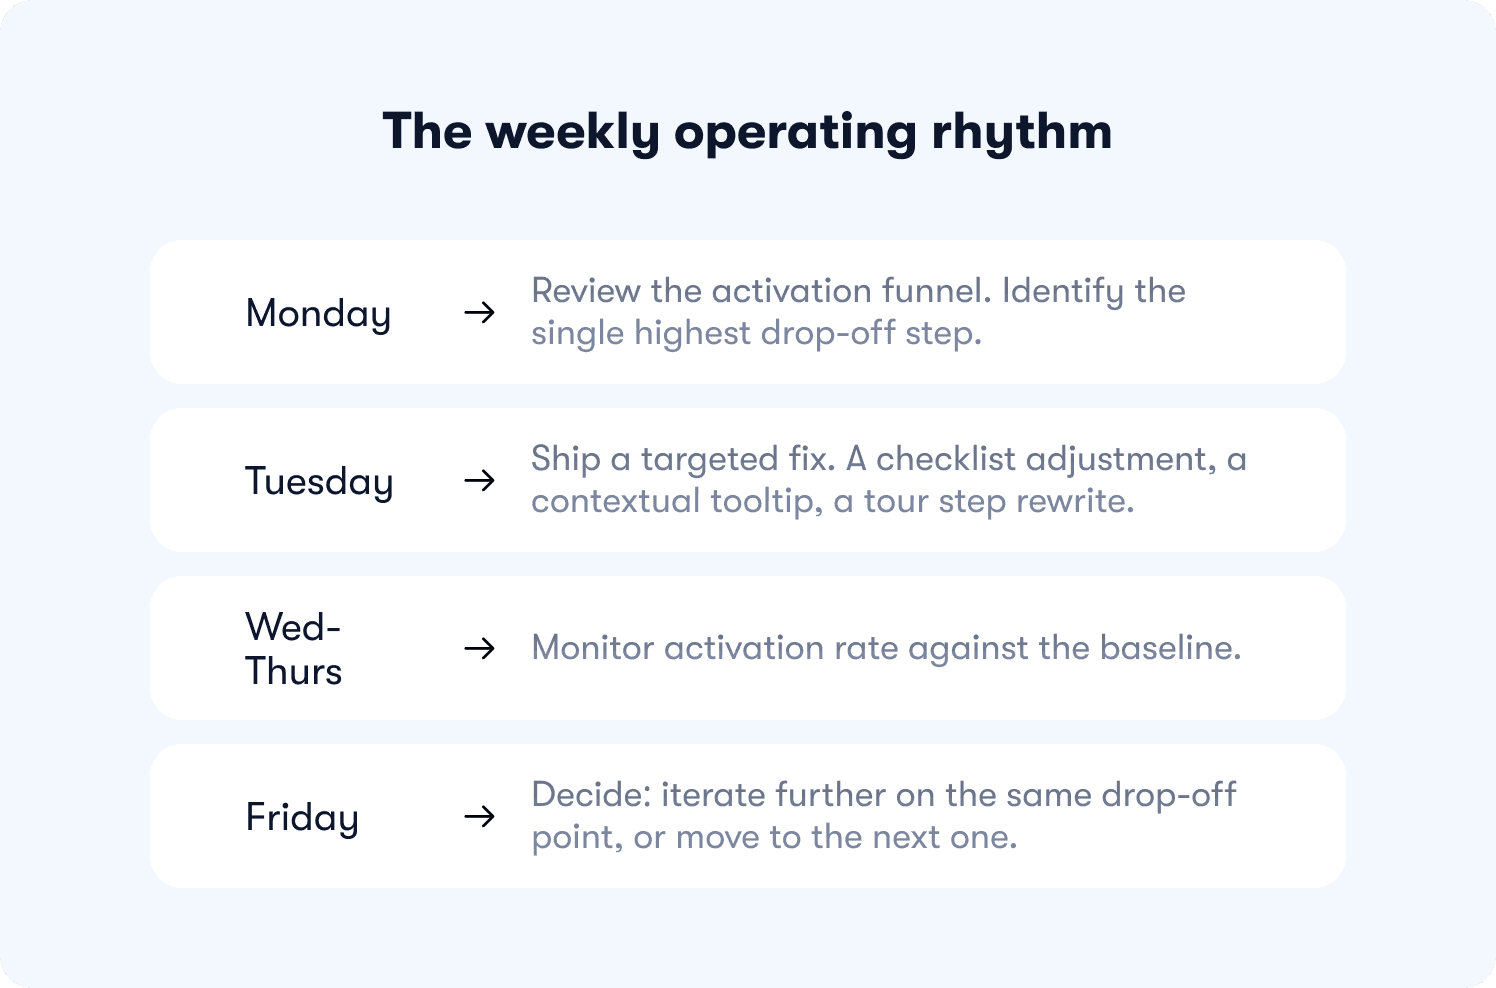
Monday: Review the activation funnel. Identify the single highest drop-off step.
Tuesday: Ship a targeted fix. A checklist adjustment, a contextual tooltip, a tour step rewrite.
Wednesday to Thursday: Monitor activation rate against the baseline.
Friday: Decide: iterate further on the same drop-off point, or move to the next one.
Genially made this shift, moving from email announcements to in-app contextual guides without changing the product itself. Activation improved 25%. The cadence did the work, not a redesign.
The no-code prerequisite
This cadence breaks the moment fixing a drop-off step requires an engineering sprint. If the tooling creates a queue, the queue kills the rhythm. Teams running a weekly iteration loop need to streamline the onboarding process without touching code, which means the product team owns the changes end to end.
Hivebrite's one-person team built 20+ tours in 90 days using Jimo's no-code builder, with segmentation, conditional logic, and behavioral triggers configured directly in the digital adoption platform without engineering involvement. That's what the weekly cadence looks like when the tooling supports it.
For the step-level execution detail on rebuilding individual onboarding flows within this cadence, the SaaS onboarding checklist covers the implementation layer in full.
Why your onboarding completion rate is misleading you
Completion data and flat conversion aren't contradictory. They're the same structural flaw expressed in two different dashboards. Before changing any onboarding content, change what you're measuring, because the problem may be the metric, not the flow.
The false positive mechanism
Completion-based milestones are satisfiable without performing the activation behavior. A user can watch the tutorial, check the box, and never use the feature. The checklist reports success. Activation doesn't move.
The audit question for every onboarding step is direct: can a user complete this step without performing the activation behavior? If yes, that step is producing false positive completion data and masking the real drop-off point.
The fix isn't clearer copy. It's action-gated milestones. Consider the difference between these two checklist items:
"Set up your workspace" — completable with a single click, no activation behavior required
"Connect your Slack workspace" — requires a real action, creates a real dependency, moves the user toward value
One satisfies the step. The other performs it. The interactive walkthrough software you use needs to be able to enforce that distinction, otherwise completion will always be a ceiling metric rather than a leading indicator.
The Room: what action-gated milestones actually produce
The Room identified CV uploads as their core activation event. Rather than prompting users to upload at signup and moving on, they deployed contextually triggered reminders that enforced the behavior at the moment of relevance. CV uploads increased 75% in ten days. The product didn't change. The milestone required the behavior instead of approximating it.
When activation rate becomes the north star metric and completion rate becomes a secondary diagnostic, the optimization roadmap changes entirely. Steps that produce high completion and low subsequent activation get rebuilt first. Steps that produce lower completion but higher activation get protected.
How to run B2B SaaS onboarding across multiple user roles
In most B2B SaaS products, the person who evaluates the product, the person who configures it, and the person who uses it daily are three different people. A single onboarding path serves none of them, and the damage shows up in account-level activation rates that mask role-level failure.
The three paths and what each one requires
Each role has a distinct activation event. Treating them as one produces averaged outcomes that underperform for everyone:
Admin: Activation means the product is configured for the team. Their path is setup-first, with every step oriented toward making the product usable for others, not just themselves.
End-user: Activation means completing a first task without hitting friction from incomplete setup. Their path should only begin once the admin has activated, otherwise they inherit the admin's unfinished configuration as their first experience.
Champion: Activation is cumulative, not a single event. Champions need value evidence that compounds over time, enough to justify expansion or renewal to leadership. A one-time activation moment doesn't serve them. A digital workflow that surfaces milestone data at usage thresholds does.
The invite timing decision
When admins invite teammates before activating themselves, they create a dependency loop. End-users arrive to an incomplete product configuration and stall. Accounts where admins invite before activating produce lower multi-user adoption and churn faster. The invite step belongs after admin activation, not before it. In product-led growth benchmarking, premature teammate invites are among the most consistently cited activation killers.
The champion path as an expansion motion
Champions don't need a better onboarding tour. They need value evidence at the right moment. When a PM can show leadership "our team saved 120 hours this quarter," renewal becomes a straightforward conversation. Jimo's success tracker triggers milestone celebrations automatically at usage thresholds, with expansion CTAs built in, making the champion path a built-in revenue motion rather than a manual CS effort.
Jimo's behavioral segmentation routes each role to its activation event from the moment of signup, deploying role-specific product tours and checklists per stakeholder without engineering dependency. The CPO metric this ultimately moves isn't just trial-to-paid conversion. It's net revenue retention, because accounts where all three roles reach their activation moments expand instead of churn.
Onboarding is either a revenue lever or a setup checklist. Which one are you running?
The architecture of a successful SaaS onboarding process comes down to three decisions made before any flow is built: how activation is defined, how users are segmented, and how the process is measured. Get those right, and every design decision downstream compounds. Get them wrong, and completion rates will keep looking acceptable while conversion stays flat.
After reading this article, you can now do three things you couldn't before:
Define and validate a measurable activation moment using cohort analysis, with a 2x conversion rate difference as the minimum validation threshold.
Design segment-specific paths that route each stakeholder, admin, end-user, and champion, toward their relevant success event without engineering dependency.
Run a weekly optimization cadence that connects onboarding changes directly to trial-to-paid conversion, not just completion rate.
Three principles sit underneath all of it:
Guide, don't lecture. Every tactic covered here, interactive tours, contextual hints, behavior-based triggers, follows the same logic: meet users where they are, not where you think they should be.
Measure obsessively, iterate weekly. The companies that win at activation aren't the ones with the best onboarding. They're the ones who iterate fastest. Small, continuous improvements compound faster than big quarterly redesigns.
Remove friction, don't add features. The gap between "feature exists" and "user discovers it" is where activation lives. The highest-leverage improvements in this article are about making existing value visible, not building new things.
This applies to scaling B2B SaaS teams with dedicated product or growth functions and a self-serve or trial-based onboarding motion. If your team doesn't yet own an adoption process end to end, the organizational prerequisite comes before the tooling.
Ready to stop guessing where conversion stalls? Book a strategy call to map your activation funnel and identify exactly where users drop off before they pay.
FAQs
What is a SaaS activation moment and how do I find mine?
Activation is the specific in-product event after which users are significantly more likely to retain and convert to paid — not tour completion, not profile setup. To find it, run cohort analysis on users who retained vs. churned in the first 30 days. What action did retained users take that churned users didn't? Validate it: users who hit this event should convert to paid at 2–3x the baseline rate. For Slack it was 2,000 messages. For Dropbox, the first file upload.
How many onboarding paths should I build for different user segments?
Start with two to four paths — enough to cover meaningful role or use case differences without creating a maintenance burden. Segment by role (admin vs. end-user vs. champion), plan tier (free vs. paid), and primary use case from two to three signup questions. Track activation rate by segment. Your overall 30% might be hiding a 50% rate for one persona and 15% for another — that gap tells you where to focus next.
Why does high tour completion not translate to activation?
Because completion-based milestones can be satisfied without performing the activation behavior. A user can click through a checklist without ever using the feature it describes. The fix is action-gated milestones — steps that require the real behavior, not a click-through. Track activation rate (users who perform the success event within seven days) as your primary metric, not tour completion rate.
How often should I update my onboarding flows?
Weekly, not quarterly. Review your activation funnel every Monday, identify the biggest drop-off, ship a targeted fix (checklist step, tooltip, or tour), and measure the impact by Friday. Teams running this cadence test 12 onboarding hypotheses per quarter instead of one or two. Onboarding that requires engineering to change can't compete with that speed — no-code tooling is the prerequisite for this cadence.
What onboarding metrics should I track instead of completion rate?
Three metrics matter: activation rate (percentage of users who reach the defined success event within seven days), time-to-activation (median hours from signup to first success event), and activation-to-retention correlation (do activated users retain at 2–3x the rate of non-activated users?). Supplement with one-question friction surveys at your highest drop-off points to catch confusion in real time rather than reading it in churn data after the fact.


